Case StudiesBuilding Ask Aida: lessons from bringing conversational AI to CACI’s data
Building Ask Aida
Lessons from bringing conversational AI to CACI’s data
Discover how CACI built a powerful, secure, customer-facing AI interface for trusted data analysis – how we did it and how we support our customers.
Launched in June 2026, Ask Aida is CACI’s conversational AI interface for our consumer and market products and services. The challenge was simple: create a familiar, chat-style AI interface that can be used by anyone to surface CACI’s data.
We decided to build Ask Aida from scratch. It needed to meet the customer demand of making CACI’s data easier to access against the backdrop of a rapidly evolving AI landscape. It also needed to broaden access to data and insights to anyone in an organisation, irrespective of their data literacy.
Where Ask Aida differs from regular AI tools is that it offers access to CACI’s data and models, as well as enabling customers to layer in their own data when performing analysis. Type in a question, receive an answer. It sounds simple and familiar, doesn’t it?
Our primary goal in building Ask Aida was to enhance and democratise access to CACI’s data, models and services. Low-friction access was created by providing an easy-to-use conversational interface. The aim was to make analysing data and drawing out insights easy for everyone, thereby removing bottlenecks such as needing to book in analysts’ time or updates to dashboards.
At the same time, our customers were requesting help and guidance in implementing AI in their businesses. “We thought, what better way to help our customers than having been through this whole transformation problem ourselves first?” explains Stewart Moody, head of product at CACI. “Our customers were having problems with this. If we could solve this ourselves quickly, and make AI work for us in practice, there is value to our customers in being able to share our learning.”
Generative AI is changing how people interact with data, but the foundations are familiar to us at CACI. For decades, we’ve combined rich data, advanced algorithms and technology to help organisations make better decisions. AI now gives us the opportunity to make that intelligence considerably easier to access and act upon. Our team had extensive AI experience, fitting it into workstreams across the business. This led to the realisation of the revolutionary potential of AI at an early stage.
Building Ask Aida: how we did it
“We were creating AI tools within our existing products,” says Stewart. “But the experience was still skewed by the user journeys of those products that were built before GenAI existed – heavy UI, then a simple conversational experience. “When we were considering what the market was demanding, what users really need, and all the tools available, we decided to act like a start-up and simply build, from the ground up, what was right for the use cases given the tools and technologies we now have. “Our team was faced with several options in achieving this. Starting out in April 2025, the AI landscape was evolving rapidly. There were myriad technology options and no set way of building and realising a project like Ask Aida. “We had to make educated guesses on some of the tools we used. A good example is the team’s use of the model context protocol (MCP). MCP is now the de facto way of connecting AI agents and data sources. We experimented with it at the time, seeing that it’s a great tool that was gaining traction. It was a successful experiment. We played with a few other technology choices as well, some turning out better than others.”
To watch this video, please enable Marketing cookies.
Testimonial
Ask Aida has a clean, familiar interface which is easy to navigate. I use it to speed up analysis that I perform regularly. Having to enter Excel and form pivot charts and tables several times a day can be replaced by Ask Aida.
Fergus Connor
Insights Analyst – New West End Company
Testimonial
I like the easy to use, straightforward interface. Ask Aida helps to make better decisions for ourselves and our key stakeholders when assessing the strength of areas, or comparing their retail sector to similar locations.
Callum Stephenson
Associate Director – GCW
Ask Aida: the project that never sleeps
Ask Aida is an ongoing project. It’s not a tool that we’ve built, then been able to sit back and admire our work. The AI landscape is still evolving, so the tech behind Ask Aida requires constant review. Where necessary, the team will replace them with new components that come to market and enhance Ask Aida. It’s a story of constant evolution and improvement.
”We quickly realised we could spend three years working out the perfect tool, only for it to be out of date by the time of release,” adds Stewart. “So, this start-up mentality has worked well. We productionised Ask Aida for internal users seven months after writing the first line of code, often using agents to write the code for us. We’ve then been able to adapt to new challenges and embrace new technologies rapidly as the project advanced. The same mindset exists within the team now.”
To watch this video, please enable Marketing cookies.
Testing for responsible AI use
One of the major challenges with any AI tool is the potential for hallucinations and inappropriate answers. To reduce these risks, our dedicated team of data and AI ethics experts, led by Sue MacLure, rigorously stress-tested Ask Aida’s responses for errors, bias and potentially offensive content.
From this, we implemented denied topics, which is critical to ethical use of AI. “The principle sounded great,” says Stewart, “but once we turned all this stuff on, Ask Aida became the biggest ‘computer says no’ system in the world. It was avoiding responding to legitimate questions. That took some fixing, but it was a good learning curve.”
Why CACI built Ask Aida
With the intention to build an AI tool with a familiar feel, what has set Ask Aida above and beyond the established names in the AI space? Why wouldn’t you just use a tool like Copilot instead?
Our team ran several side-by-side tests with Copilot during the development of Ask Aida. This was done to ensure that Ask Aida was hitting its targets and that it was offering value beyond publicly available data that other AI products typically have access to.
The team concluded that Ask Aida, with its unique access to CACI’s data, when asked to provide insight on consumer and market data, was providing more comprehensive responses than Copilot in 90% of instances. This ensured that Ask Aida was successfully surfacing CACI’s data in a meaningful, conversational and familiar way for users.
Trust and security first
CACI is Cyber Essentials+ certified, but we wanted to go beyond that standard in ensuring that Ask Aida is as secure as possible. “We worked with our American parent company’s red team and challenged them to behave like a hacker and see if they could get in and cause mischief,” explains Stewart.
“This proved to be a huge success, unearthing improvements we could make and implement to strengthen the security of Ask Aida and absolutely minimise the risk of external threats. We’re now able to take the learnings from that and apply them across the rest of our product portfolio, running security checks with our US parent to ensure that they are as secure as possible.”
AI foundations to support our customers
Trust sits at the heart of Ask Aida. Without trust, users lose faith in the responses and when that happens, they walk away from the product. From conception to delivery, we’ve thought about and designed Ask Aida as a trusted source of valuable insight to our customers. In providing a very simple output via a text interface, a lot of complex design and implementation has taken place in the background.
We’re proud of what Ask Aida has achieved. We’ve been able to deliver a tool which facilitates data analysis and democratises access to it. It looks simple, but the process behind it has been anything but.
From deciding on which technology solutions to use, ensuring appropriate responses and getting the security right, the Ask Aida project has been a huge success for CACI. It lays the foundations for future AI products and the ongoing support of customers in their own AI projects.
We’re excited to put our AI learnings and foundations into practice for our customers, working across the many industries and sectors they represent. Want to learn more about Ask Aida? Visit the software page.
Case Studies
Wingstop
Translating digital demand into data-led location planning for Wingstop
How Wingstop translated digital demand into data-led location planning and scalable UK growth
Summary
Wingstop is one of the UK’s most exciting fast-food brands, with 1.1 million followers and ~70% of sales coming from 16-34-year-olds. CACI helped Wingstop translate this digital demand into real-world value by combining multiple data sources to determine how many restaurants the market could support, which towns to prioritise and where to place new sites.
The result was an interactive tool that removes subjectivity and outdated retail logic from expansion planning. Instead, Wingstop can dynamically assess opportunities and build a repeatable growth engine to identify total market capacity and maximise market share, brand awareness and ROI without overinvesting in its estate.
Company size
1,000+
Industry
Retail
Services used
Products used
Challenge
Wingstop UK needed a repeatable way to convert strong consumer demand into the right network decisions. Its primary challenges were:
Translating fast-growing digital and cultural popularity into sustainable, real-world restaurant expansion.
Prioritising the strongest towns and cities without overinvesting in locations that could dilute returns.
Balancing eat-in, takeaway and delivery potential against customer behaviour, store performance, footfall, demographics, competition and destination strength.
Giving decision-makers a consistent, accessible evidence base to reduce subjectivity and accelerate site approval.
Solution
To understand market potential, brand alignment and where Wingstop should grow next, CACI developed a bespoke national location strategy combining Wingstop and CACI data. The approach brought multiple performance metrics together in an easily interpretable framework to identify the towns, cities and locations with the strongest potential.
The data included:
Eat-in versus takeaway opportunity: Overall sales, transactional spend, customer behaviour, store performance, workplace population, residential population, footfall and competitor strength.
Delivery dynamics in each location: Retail destination strength (e.g. size of retail centre, volume of stores occupied, overall spend levels, leisure/retail mix), delivery catchments (e.g. public transport, ease of access).
With overall market capacity and UK growth potential established, CACI identified priority towns, viable retail destinations and micro-locations for future restaurants. This multi-channel view helped Wingstop prioritise opportunities based on their potential to drive sales, meet customer demand and build long-term brand visibility.
These results were presented in a dynamic, scorecard-led framework, giving Wingstop a practical way to compare opportunities consistently. This gave decision-makers, internal stakeholders and investors greater confidence as they reached 100 UK restaurants.
Locations were not judged purely on property availability or historic retail logic, but on their ability to build sales, serve customer demand and amplify the Wingstop brand.
Testimonial
As we’ve grown Wingstop across the UK, CACI has been an invaluable partner. Their expertise and insight have helped us make smarter location decisions and support our ambitious growth plans.
Adrian Saunders
Head of Acquisitions, Wingstop
Results
Through this partnership, Wingstop gained a self-serve, repeatable growth engine that supports immediate site decisions and long-term estate planning. The success of the initial programme has led to the next iteration of the strategy, using updated store, customer and market evidence.
Since September 2025, Wingstop has used the location strategy and scorecard framework to support investment decisions on more than 50 new restaurant opportunities, providing a consistent, evidence-based approach to site selection across its UK expansion programme.
The brand has opened 34 new restaurants during this period, expanding its estate while maintaining confidence in location quality and long-term performance.
Alongside its data-led expansion strategy, turnover has increased by 25%, as Wingstop continues turning consumer demand and cultural momentum into commercial growth.
Wingstop now operates 100 UK restaurants, reinforcing its position as one of the UK’s fastest-growing restaurant brands.
Case Studies
Chopstix
Data-Driven success for franchise and equity growth
GLP-1 medications are creating new opportunities for brands as consumers increasingly prioritise health, wellbeing and lifestyle goals.
As adoption grows, particularly following the introduction of more accessible treatment formats, spending is shifting towards products and services that support these ambitions, creating a new consumer segment with distinct needs and preferences. Organisations that understand these changing behaviours can adapt their products, experiences and marketing strategies to unlock growth opportunities.
Who is the GLP-1 consumer and what do you need to know about them?
A reported 6.3% of British households have at least one GLP-1 user as of 2026, nearly triple the proportion seen in 2024 (2.3%), according to Worldpanel by Numerator. CACI’s Voice of the Nation survey, conducted across 2,000 UK adults in H1 2026, found that 13% of the UK population already self-pay for some form of weight loss product and 15% expect to pay for such products in 2026. Although these results aren’t based on GLP-1 medication use, the introduction of oral GLP-1 tablets in the UK is likely to have accelerated interest in weight loss products, as they are seen as more convenient by many.
Importantly, there is no single consumer profile for those using weight loss products. Adoption varies by age, location, household income and life stage, resulting in different spending patterns and engagement preferences across consumer groups. Understanding these nuances is critical for brands looking to identify emerging opportunities and target growth effectively.
What age groups are most engaged with weight management products?
Current users and prospective users do not always look the same, but younger adults are driving much of the demand for weight loss products. Our research found that almost a quarter (23%) of Gen Z respondents paid for a weight management product or treatment in 2025, making them the generationmost likely to self-fund weight loss treatment.
Retention is also high once people have started using weight loss products, with two-thirds (67%) of those who paid for weight loss treatments in 2025 expecting to do so again in 2026, according to our data.
As treatment becomes more accessible, adoption is likely to expand across all age groups, with younger consumers continuing to drive future growth.
What are their average incomes & affluence levels?
Observing CACI research through the lens of Acorn, CACI’s geodemographic segmentation of the UK population at postcode level, the anticipated take-up of weight management products and treatments varies significantly across consumer groups:
Upmarket Families (typical age 35+)
Prosperous Professionals (typical age range 25 – 44)
Up-and-Coming Urbanites (typical age range 18 – 34)
Limited Budgets (typical age range 25 – 49)
5%
20%
23%
20%
What weight management products are they using?
Our survey revealed that, among consumers currently using weight loss medication, tablets are the most popular option overall, chosen by 38% compared to 21% using self-administered injections. Tablet use is particularly high among those within the Limited Budgets Acorn group (48%) and Traditional Homeowners (33%). Family Renters are more likely to opt for meal replacements, with 39% choosing this option.
While respondents were not referring to GLP-1 tablets, these results suggest that greater convenience and accessibility encourage adoption among consumers who may be reluctant to use injectable treatments. With GLP-1 tablets having entered the UK market, we anticipate consumers continuing to opt for this format.
Identifying the opportunities
The rise of GLP-1 adoption tends to be associated with lower food consumption. Households with a GLP-1 user are spending an average of £418 less per year on groceries than non-user households. Brands must consider where demand is shifting to understand how these changing behaviours influence purchasing decisions and adapt products, services and experiences to meet consumers’ evolving needs.
Food & beverage
The food sector has experienced the most immediate impact from GLP-1 adoption.
As consumers become increasingly conscious of nutritional value, brands have an opportunity to move beyond volume-based purchasing behaviours and focus on quality-led consumption, such as:
Protein-rich meals and snacks
Nutrient-dense ready meals
Fresh produce and minimally processed foods
Functional foods that support wellness goals
Smaller portions with enhanced nutritional value
Meal solutions that balance convenience and health
As appetite levels change, brands that communicate nutritional benefits clearly and make healthy choices simple and accessible are likely to resonate strongest.
For retailers, category growth may increasingly come from premiumisation, nutrition-led innovation and value-added convenience rather than traditional volume growth alone.
Hospitality & quick service restaurants (QSRs)
For hospitality operators, changing consumer appetites do not necessarily mean fewer opportunities. Instead, operators may need to rethink what consumers value from eating out, such as:
Smaller-format menu options
Protein-focused and wellness-led menu innovation
Customisable portion sizes
Experience-led dining occasions
Food-and-entertainment concepts
Premium ingredients and transparent nutritional information
Success will increasingly depend on delivering experiences and value beyond portion size alone.
Health, wellness & healthcare
Health, wellness and healthcare brands are well positioned to benefit from growing consumer investment in personal wellbeing. As focus on long-term health outcomes increases, demand may grow for:
Nutritional supplements
Protein and muscle-maintenance products
Wellness coaching and lifestyle programmes
Patient support programmes
Adherence tools and digital health services
Nutritional guidance and education
Preventative health solutions
Complementary wellness products
As adoption grows, organisations that support the wider health journey, not just treatment, will be best placed to build long-term value, trust and engagement. The trend extends beyond weight management, reflecting increasing consumer investment in overall health and wellbeing.
One of the more unexpected beneficiaries of GLP-1 adoption may be the fashion sector.
As many consumers experience weight loss and body shape changes, there is often renewed demand for clothing as wardrobes need updating to reflect new sizing requirements and style preferences. This creates opportunities across:
Core wardrobe essentials
Flexible sizing ranges
Personal styling services
Occasion wear
Premium fashion purchases
In-store fitting experiences
Many consumers view weight-loss milestones as part of a broader lifestyle transformation, creating engagement opportunities with shoppers around confidence, self-expression and personal identity.
How organisations can respond to these changes
Leading brands will:
Use data and consumer intelligence to identify adoption hotspots and growth audiences
Develop nutrition-led product ranges
Clearly communicate health and wellness benefits
Offer greater flexibility in portions, formats and pricing
Invest in personalisation and targeted marketing
Create experiences that deliver value beyond the core transaction
Key takeaways
Understanding today’s weight management consumers, and how their behaviours may evolve as GLP-1 treatments become more accessible, will be critical for organisations looking to stay ahead of changing market dynamics.
The opportunity is significant. The market is being driven by young, loyal, repeat consumers who are increasingly health conscious. Brands that position themselves well now will reap lasting benefits from these innovative medications.
Combining consumer, demographic and location data, they generate a richer understanding of consumers, where they live, their behaviours and lifestyle trends that shape their decision-making. These insights can help identify and understand GLP-1 users, their habits and potential implications for consumer spending and product preferences.
By identifying these emerging audiences, you can make better-informed decisions around product development, location strategy and investment.
Retail Data Analytics: The Definitive Guide to Data-Driven Retail Growth
Antoine Senkoff
Retailers are generating and collecting more data than ever before. Every customer interaction whether it takes place in-store, online, through a mobile app, a loyalty programme or a retail media network, creates valuable information that can be used to improve decision-making.
In this environment, retail data analytics is no longer simply a reporting function. It has become a strategic capability that helps retailers understand customer behaviour, forecast demand, optimise inventory, improve marketing performance and make faster, more profitable decisions.
What is retail data analytics?
Retail data analytics is the process of collecting, integrating, analysing and interpreting retail data to improve decision-making across sales, marketing, inventory management, customer experience, pricing and operations.
By combining data from point-of-sale systems, ecommerce platforms, loyalty programmes, customer relationship management (CRM) systems, inventory management platforms and digital marketing channels, retailers can identify trends, forecast demand, optimise operations and improve profitability.
Modern retail analytics helps organisations answer four critical business questions:
What happened?
Why did it happen?
What is likely to happen next?
What should we do about it?
As retail becomes increasingly omnichannel and customer expectations continue to rise, retail data analytics has evolved from a competitive advantage into a business necessity.
Benefits of retail data analytics
Retail analytics delivers measurable value across customer experience, merchandising, operations, inventory management and profitability.
While specific outcomes vary by retailer, the business benefits are often substantial.
Improved customer understanding
Retailers generate customer data from numerous touchpoints.
Analytics helps organisations transform this information into a deeper understanding of customer behaviour.
Insights include:
Purchase history
Product preferences
Shopping frequency
Channel preferences
Customer lifetime value
Churn risk
This enables retailers to create more relevant and personalised customer experiences.
Retail analytics enables organisations to incorporate historical sales data, seasonality, promotions, economic factors, weather patterns and local events into forecasting models.
Improved forecasts help retailers:
Reduce stockouts
Avoid overstocking
Improve inventory productivity
Increase availability
Inventory optimisation
Inventory is one of the largest investments within retail businesses.
Analytics supports:
Replenishment planning
Safety stock optimisation
Allocation decisions
Assortment planning
Benefits include:
Lower inventory carrying costs
Improved stock availability
Reduced markdowns
Better working capital efficiency
More effective marketing
Marketing analytics enables retailers to understand which activities generate the greatest return.
Analytics supports:
Campaign attribution
Customer segmentation
Personalisation
Media optimisation
Audience targeting
This allows marketing budgets to be allocated more effectively.
Improved pricing decisions
Pricing remains one of the most powerful drivers of retail profitability.
Retail analytics helps organisations evaluate:
Competitor pricing
Demand elasticity
Promotional effectiveness
Margin performance
This enables more informed pricing decisions that balance competitiveness and profitability.
Faster decision-making
Modern retail analytics platforms provide near real-time visibility into performance. Decision-makers can identify issues and opportunities more quickly.
Examples include:
Emerging stockouts
Sales anomalies
Operational bottlenecks
Customer behaviour changes
Faster insights enable faster action.
Increased profitability
Ultimately, retail analytics supports more profitable decision-making. Improved forecasting, inventory management, pricing and marketing effectiveness contribute directly to business performance.
For many organisations, retail analytics becomes a strategic growth enabler rather than simply a reporting capability.
How retail data analytics works
Retail analytics is not simply about creating dashboards.
Successful analytics programmes follow a structured process that transforms raw data into actionable business intelligence.
Step 1: Data Collection
The first step is collecting data from relevant retail systems.
The most successful retailers embed analytics into everyday business processes, ensuring data-driven decision-making becomes part of organisational culture.
The four types of retail data analytics
Retail analytics can be broadly divided into four categories: descriptive, diagnostic, predictive and prescriptive analytics.
Each type answers a different business question and represents a progressively more advanced level of analytical maturity.
Understanding how these analytics types work together helps retailers move beyond reporting and towards proactive decision-making.
1. Descriptive analytics: What happened?
Descriptive analytics focuses on summarising historical performance.
It provides visibility into key retail metrics and helps organisations understand what has already occurred.
Common examples include:
Sales reporting
Revenue analysis
Inventory reports
Website traffic analysis
Customer acquisition reporting
Store performance dashboards
Typical retail KPIs include:
Revenue
Gross margin
Average order value (AOV)
Conversion rate
Inventory turnover
Stockout rate
For example, a retailer may discover that online sales increased by 12% last month or that a specific category underperformed against plan.
Descriptive analytics forms the foundation of all retail analytics programmes.
However, it does not explain why performance changed.
2. Diagnostic Analytics: Why did it happen?
Diagnostic analytics investigates the causes behind business outcomes.
It helps retailers identify patterns, drivers and relationships within data.
Common applications include:
Root-cause analysis
Promotion effectiveness analysis
Customer churn analysis
Basket analysis
Product performance analysis
Example: A retailer notices declining sales in a product category. Diagnostic analytics may reveal:
Increased competitor pricing activity
Reduced product availability
Changes in customer demand
Declining marketing effectiveness
By understanding why something happened, organisations can take corrective action more effectively.
3. Predictive analytics: What is likely to happen next?
Predictive analytics uses historical data, statistical modelling and machine learning to forecast future outcomes.
This is one of the fastest-growing areas of retail analytics as organisations increasingly adopt AI-powered decision-making.
Common predictive retail use cases include:
Demand forecasting
Customer lifetime value prediction
Churn prediction
Inventory forecasting
Workforce planning
Promotion forecasting
For example, predictive models may estimate:
Future sales demand
Likelihood of customer churn
Inventory requirements
Promotional performance
Predictive analytics helps retailers become proactive rather than reactive. Instead of responding to events after they occur, organisations can prepare for likely future scenarios.
4. Prescriptive analytics: What should we do?
Prescriptive analytics goes one step further.
Rather than simply predicting outcomes, it recommends actions that will optimise results.
Prescriptive analytics combines:
Predictive modelling
Optimisation algorithms
Business rules
Artificial intelligence
Common retail applications include:
Dynamic pricing
Inventory allocation
Assortment optimisation
Promotion planning
Workforce scheduling
Supply chain optimisation
For example, a prescriptive analytics system may recommend:
Increasing inventory in specific stores
Adjusting product pricing
Launching targeted customer offers
Reallocating marketing spend
This represents the highest level of analytics maturity and increasingly relies on AI-driven automation.
Retail data analytics framework
Successful retail analytics programmes typically focus on five interconnected pillars.
Customer analytics
Focuses on understanding customer behaviour and preferences.
Examples include:
Customer segmentation
Lifetime value analysis
Churn prediction
Personalisation
Key question: Who are our most valuable customers and how can we improve retention?
Merchandising analytics
Supports product and assortment decisions.
Examples include:
Product performance analysis
Category management
Assortment optimisation
Basket analysis
Key question: Which products should we stock, promote and expand?
Inventory analytics
Focuses on inventory efficiency and availability.
Examples include:
Demand forecasting
Replenishment optimisation
Inventory allocation
Stockout analysis
Key question: How can we maximise product availability while minimising inventory costs?
Marketing analytics
Measures marketing effectiveness.
Examples include:
Attribution modelling
Campaign performance
Customer acquisition analysis
Return on ad spend (ROAS)
Key question: Which marketing activities drive the highest return?
Operations analytics
Focuses on store and operational performance.
Examples include:
Labour optimisation
Store productivity
Supply chain analytics
Fulfilment performance
Key question: How can we improve operational efficiency and profitability?
Retail data analytics KPIs every retailer should track
Choosing the right KPIs is critical to measuring performance and identifying opportunities for improvement.
The most effective retail KPI frameworks balance financial, customer, operational and inventory metrics.
Revenue and profitability KPIs
Revenue
Total sales generated over a defined period.
Gross margin
Revenue minus cost of goods sold.
Gross margin return on inventory investment (GMROII)
Measures how efficiently inventory generates profit.
Average order value (AOV)
Average value of each transaction.
Formula:
Revenue ÷ Number of Orders
Customer KPIs
Customer lifetime value (CLV)
Estimated value a customer generates throughout their relationship with the retailer.
Customer acquisition cost (CAC)
Cost of acquiring a new customer.
Retention rate
Percentage of customers retained over time.
Churn rate
Percentage of customers who stop purchasing.
Inventory KPIs
Inventory turnover
Measures how efficiently inventory is sold.
Sell-through rate
Percentage of inventory sold during a given period.
Stockout rate
Frequency of inventory shortages.
Weeks of supply
Number of weeks current inventory is expected to last.
Ecommerce KPIs
Conversion rate
Percentage of visitors who complete a purchase.
Cart abandonment rate
Percentage of shoppers who leave without completing a purchase.
Revenue per visitor
Revenue generated per website visitor.
Return rate
Percentage of products returned.
Marketing KPIs
Return on advertising spend (ROAS)
Revenue generated per advertising dollar spent.
Cost per acquisition (CPA)
Average cost of acquiring a customer.
Customer engagement rate
Measures interaction across channels.
Measuring retail analytics ROI
One of the most common challenges facing retail leaders is demonstrating the value of analytics investments.
Every analytics initiative should be linked to measurable business outcomes.
Common retail analytics ROI metrics
Revenue growth
Examples include:
Increased sales
Higher conversion rates
Improved customer retention
Cost reduction
Examples include:
Reduced inventory costs
Lower fulfilment costs
Reduced markdowns
Productivity improvements
Examples include:
Faster reporting
Reduced manual effort
Improved workforce efficiency
Customer experience improvements
Examples include:
Higher satisfaction scores
Increased loyalty
Improved retention
Retail analytics ROI benchmark framework
Analytics Initiative
Primary Outcome
Demand Forecasting
Improved forecast accuracy
Inventory Optimisation
Reduced stockouts and excess inventory
Customer Segmentation
Increased campaign effectiveness
Pricing Analytics
Improved margins
Marketing Analytics
Higher ROAS
Supply Chain Analytics
Reduced operating costs
Personalisation
Increased customer lifetime value
The most successful retailers establish clear success metrics before launching analytics initiatives and continuously measure performance against those objectives.
Retail data analytics use cases: Where retailers create the most value
Retail analytics delivers value when insights are translated into business action.
While reporting and dashboards provide visibility into performance, the greatest benefits come from using analytics to optimise decisions across customer experience, merchandising, inventory, pricing and operations.
The following use cases represent some of the highest-impact applications of retail data analytics.
Customer analytics
Customer analytics focuses on understanding customer behaviour, preferences and purchasing patterns.
As retailers increasingly compete on customer experience, customer analytics has become one of the most strategically important areas of retail analytics.
Customer segmentation
Not all customers behave in the same way.
Customer segmentation groups shoppers based on shared characteristics such as:
Purchase frequency
Spending behaviour
Product preferences
Demographics
Channel usage
Engagement levels
Common segmentation models include:
Behavioural segmentation
Groups customers based on actions and purchasing patterns.
Value-Based segmentation
Groups customers based on profitability and lifetime value.
Lifecycle segmentation
Groups customers according to their stage in the customer journey.
Examples include:
New customers
Active customers
At-risk customers
Lapsed customers
Segmentation enables retailers to deliver more relevant marketing, improve retention and allocate resources more effectively.
Customer lifetime value analysis
Customer Lifetime Value (CLV) measures the total value a customer is expected to generate throughout their relationship with a retailer.
Rather than focusing solely on individual transactions, CLV helps organisations evaluate long-term customer profitability.
Benefits include:
Improved acquisition strategies
Better marketing investment decisions
More effective loyalty programmes
Higher retention rates
Retailers increasingly use predictive analytics to estimate future customer value and identify high-potential customer segments.
Churn prediction
Acquiring new customers is often significantly more expensive than retaining existing ones.
Churn analytics helps retailers identify customers who are at risk of disengaging or leaving.
Common signals include:
Reduced purchase frequency
Declining spend
Lower engagement levels
Increased returns
Reduced loyalty activity
Predictive models can identify at-risk customers before they churn, enabling proactive retention initiatives.
Personalisation and recommendation engines
Personalisation has become a cornerstone of modern retail strategy.
Retail analytics enables organisations to deliver:
Personalised product recommendations
Tailored promotions
Individualised marketing messages
Dynamic content experiences
Recommendation engines analyse:
Purchase history
Browsing behaviour
Product affinity
Customer preferences
to improve relevance and increase conversion rates.
As AI capabilities continue to evolve, hyper-personalisation is becoming a major competitive differentiator.
Inventory analytics
Inventory is often one of the largest assets on a retailer’s balance sheet.
Inventory analytics helps organisations improve product availability while reducing excess stock and carrying costs.
Demand forecasting
Demand forecasting predicts future product demand using historical and real-time data.
Modern forecasting models incorporate:
Historical sales
Promotional activity
Seasonality
Economic indicators
Weather data
Local events
Digital demand signals
Improved forecasting supports:
Better inventory planning
Reduced stockouts
Lower inventory costs
Increased product availability
As machine learning adoption grows, forecasting accuracy continues to improve across many retail sectors.
Inventory optimisation
Inventory optimisation focuses on maintaining the right inventory levels at the right locations.
Key objectives include:
Maximising availability
Minimising excess inventory
Reducing working capital requirements
Improving inventory productivity
Analytics supports decisions such as:
How much inventory to order
Where inventory should be allocated
When replenishment should occur
This is particularly important for omnichannel retailers operating across stores, distribution centres and ecommerce fulfilment networks.
Assortment optimisation
Retailers often carry thousands of products.
Not every product contributes equally to profitability.
This enables retailers to make more informed expansion decisions.
Catchment area analysis
Catchment analysis identifies the geographic area from which customers are likely to visit a store.
Insights include:
Customer density
Travel patterns
Market potential
Competitive overlap
These analyses support location strategy and marketing planning.
Artificial intelligence and machine learning in retail analytics
Artificial intelligence is transforming retail analytics.
Traditional analytics often focuses on reporting historical performance.
AI extends analytics by enabling:
Pattern recognition
Forecasting
Automation
Recommendation generation
Decision support
AI-powered analytics allows retailers to process larger datasets and generate insights at greater speed and scale.
Predictive analytics
Predictive analytics uses machine learning models to forecast future outcomes.
Common applications include:
Demand forecasting
Churn prediction
Customer lifetime value forecasting
Promotion forecasting
Inventory planning
These capabilities help retailers anticipate future conditions and act proactively.
Anomaly detection
AI can automatically identify unusual patterns within retail data.
Examples include:
Unexpected sales declines
Pricing anomalies
Fraud indicators
Inventory discrepancies
This enables faster issue detection and response.
Dynamic pricing
AI-powered pricing models continuously evaluate:
Demand levels
Competitor activity
Inventory availability
Market conditions
to optimise pricing decisions.
This capability is increasingly common in ecommerce and highly competitive retail categories.
Generative AI and conversational analytics
Generative AI is creating a new category of retail analytics.
Instead of relying solely on dashboards and reports, users can interact with data using natural language.
Examples include:
Which products are most likely to experience stockouts next month?
Which customer segments generated the highest profit last quarter?
Which stores have the strongest inventory productivity?
Generative AI translates these questions into analytical queries and delivers insights in plain language.
Benefits include:
Faster access to insights
Reduced dependency on analysts
Improved self-service analytics
Increased adoption across business teams
As generative AI platforms continue to evolve, conversational analytics is expected to become a standard component of modern retail analytics ecosystems.
Why AI-powered retail analytics matters
The volume, velocity and complexity of retail data continue to increase.
Traditional reporting approaches struggle to keep pace.
AI-powered analytics enables retailers to:
Analyse larger datasets
Identify hidden patterns
Improve forecasting accuracy
Automate routine analysis
Accelerate decision-making
For retailers seeking competitive advantage in an increasingly data-driven marketplace, AI is rapidly becoming a core capability rather than an optional enhancement.
Retail data analytics challenges and how to overcome them
While the benefits of retail data analytics are substantial, successful implementation is rarely straightforward. Many retailers invest heavily in analytics platforms but struggle to achieve widespread adoption or measurable business outcomes.
Understanding the most common challenges can help organisations develop more effective analytics strategies.
Data silos
One of the most persistent challenges in retail analytics is fragmented data.
Customer, inventory, marketing and operational data often reside in separate systems that were never designed to work together.
Examples include:
POS systems
Ecommerce platforms
CRM systems
Loyalty platforms
Marketing automation tools
ERP systems
Supply chain applications
When data remains siloed, retailers struggle to create a complete view of customers and operations.
Best practice
Invest in a unified data architecture that consolidates information into a centralised analytics environment. Modern platforms such as Snowflake, Databricks and Microsoft Fabric can help establish a single source of truth.
Data quality issues
Analytics outcomes depend on data quality.
Common problems include:
Missing data
Duplicate records
Inconsistent definitions
Outdated information
Inaccurate product hierarchies
Poor-quality data reduces trust in analytics and can lead to flawed decision-making.
Best practice
Establish formal data governance programmes that include:
Data quality monitoring
Master data management
Data ownership frameworks
Standardised KPI definitions
Skills and talent gaps
Many retailers face shortages of:
Data analysts
Data engineers
Data scientists
AI specialists
Analytics leaders
Without the right capabilities, organisations may struggle to translate data into business value.
Best practice
Combine internal capability development with external expertise and invest in analytics literacy across the organisation.
Lack of business adoption
Many analytics programmes fail because insights are not integrated into operational decision-making.
Dashboards alone rarely change behaviour.
Best practice
Focus on business outcomes rather than technology implementation.
Successful retailers embed analytics into:
Merchandising processes
Inventory planning
Pricing decisions
Marketing campaigns
Executive decision-making
Measuring value
Analytics investments are often difficult to justify when success metrics are unclear.
Best practice
Define measurable business outcomes before implementation.
Examples include:
Forecast accuracy improvement
Inventory reduction
Increased customer retention
Revenue growth
Margin improvement
How to choose a retail data analytics platform
Selecting the right analytics platform is a critical decision.
Technology choices influence scalability, usability and long-term return on investment.
Define business objectives first
The most successful implementations begin with business goals rather than technology requirements.
Questions to consider include:
Which business challenges are we solving?
Which decisions need better data?
Which KPIs matter most?
Technology should support business strategy—not the other way around.
Evaluate data integration capabilities
Retail environments often include dozens of systems.
The chosen platform should support seamless integration with:
POS systems
Ecommerce platforms
CRM systems
Marketing platforms
ERP solutions
Integration complexity often determines implementation success.
Assess scalability
Retail data volumes continue to grow rapidly.
Platforms should support:
Large datasets
Real-time analytics
AI workloads
Future growth
Cloud-native solutions often provide greater scalability and flexibility.
Consider user experience
Analytics adoption depends on usability.
Evaluate:
Dashboard design
Self-service capabilities
Natural language querying
Mobile accessibility
Collaboration features
A powerful platform that users avoid will deliver limited value.
Review AI capabilities
AI is becoming increasingly important within retail analytics.
The cheapest platform is not always the most cost-effective solution.
Retail data analytics implementation roadmap
Successful analytics transformations typically follow a phased approach.
Phase 1: Establish business priorities
Identify the highest-value opportunities.
Examples include:
Demand forecasting
Inventory optimisation
Customer retention
Pricing optimisation
Prioritise initiatives that deliver measurable outcomes.
Phase 2: Build a data foundation
Create a centralised data environment that supports analytics at scale.
Focus on:
Data integration
Data governance
Data quality
KPI standardisation
Phase 3: Deliver quick wins
Early success helps build momentum.
Potential quick-win projects include:
Executive dashboards
Inventory reporting
Customer segmentation
Marketing attribution
Phase 4: Expand advanced analytics
Once foundations are established, organisations can introduce:
Predictive analytics
Machine learning
Forecasting models
Optimisation algorithms
Future trends shaping retail data analytics
The retail analytics landscape continues to evolve rapidly.
Several trends are expected to shape the next generation of retail analytics.
Real-time analytics
Retailers increasingly require insights as events occur. Real-time analytics supports:
Inventory visibility
Dynamic pricing
Fraud detection
Operational monitoring
Customer engagement
As streaming data technologies mature, real-time decision-making will become standard.
Generative AI
Generative AI is changing how users interact with data. Emerging use cases include:
Conversational analytics
Automated report generation
Natural language querying
Insight summarisation
Executive briefing creation
Generative AI will make analytics more accessible to non-technical users.
Autonomous decisioning
The future of retail analytics is likely to involve increasing levels of automation.
Examples include:
Automated inventory allocation
Dynamic pricing adjustments
Personalised promotions
Supply chain optimisation
Marketing budget allocation
Human oversight will remain important, but decision automation will continue to expand.
Retail media analytics
Retail media networks are becoming a major revenue source for retailers. Analytics capabilities will play a critical role in:
Audience targeting
Campaign measurement
Attribution
Ad inventory optimisation
Retail media is expected to remain a major investment area over the next decade.
First-party data strategies
As privacy regulations evolve and third-party cookies decline, retailers are increasingly investing in first-party data assets.
Analytics will become central to:
Loyalty programmes
Customer identity resolution
Personalisation
Customer retention
Retailers with strong first-party data strategies are likely to gain significant competitive advantages.
Conclusion
Retail data analytics has evolved from a competitive advantage into a business necessity.
Retailers today face increasing complexity, rising customer expectations, growing competition, expanding data volumes and ongoing margin pressure. Organisations that can effectively transform data into actionable insights are better positioned to adapt, innovate and outperform competitors.
The most successful retailers use analytics to answer four fundamental questions:
What happened?
Why did it happen?
What is likely to happen next?
What should we do about it?
From customer analytics and demand forecasting to inventory optimisation, pricing intelligence and AI-powered decision-making, analytics has become central to modern retail strategy.
However, technology alone is not enough. Long-term success depends on:
High-quality data
Strong governance
Clear business ownership
Measurable outcomes
Organisation-wide adoption
Retailers that establish these foundations will be best positioned to unlock the full value of their data, improve customer experiences and drive sustainable growth in an increasingly data-driven future.
Frequently asked questions about retail data analytics
What are examples of retail data analytics?
Examples of retail data analytics include demand forecasting, customer segmentation, inventory optimisation, pricing analytics, promotion analysis and customer lifetime value modelling. Retailers use these analytics techniques to improve decision-making, enhance customer experiences and increase profitability.
Common examples of retail data analytics include:
Demand forecasting
Customer segmentation
Inventory optimisation
Pricing analytics
Promotion analysis
Customer lifetime value (CLV) analysis
Recommendation engines
Omnichannel customer journey analytics
These insights help retailers understand customer behaviour, optimise operations and identify growth opportunities.
What is the difference between retail analytics and business intelligence?
Retail analytics focuses on explaining performance, predicting outcomes and recommending actions, while business intelligence (BI) focuses on reporting and visualising historical data. Business intelligence helps retailers understand what happened, whereas retail analytics helps them understand why it happened, what is likely to happen next and what actions should be taken.
Business Intelligence
Retail Analytics
Reports what happened
Explains why it happened
Historical reporting
Predictive and prescriptive insights
KPI dashboards
Forecasting and optimisation
Performance monitoring
Decision support and recommendations
Descriptive analysis
Advanced analytics and AI
Most retailers use both business intelligence and retail analytics to support data-driven decision-making.
How can small and mid-sized retailers use data analytics?
Small and mid-sized retailers can use data analytics to improve inventory management, increase sales, understand customer behaviour and optimise marketing performance. Many organisations start with basic reporting tools before adopting more advanced analytics capabilities.
Common use cases include:
Tracking sales and product performance
Forecasting inventory demand
Identifying slow-moving stock
Measuring marketing campaign effectiveness
Analysing customer purchasing behaviour
Improving customer retention
Optimising pricing and promotions
By focusing on a small number of high-impact use cases, retailers can achieve measurable business value without significant technology investment.
What data sources are used in retail analytics?
Common data sources include:
POS systems
Ecommerce platforms
CRM systems
Loyalty programmes
Inventory systems
Supply chain systems
Marketing platforms
Customer service systems
Location intelligence data
How does retail analytics improve inventory management?
Retail analytics improves demand forecasting, inventory allocation and replenishment planning. This helps reduce stockouts, minimise excess inventory and improve inventory productivity.
How is AI used in retail analytics?
AI supports forecasting, customer segmentation, recommendation engines, dynamic pricing, anomaly detection and decision automation. Generative AI is also enabling conversational analytics and automated insight generation.
What KPIs should retailers track?
Key retail KPIs include:
Revenue
Gross Margin
Customer Lifetime Value
Conversion Rate
Inventory Turnover
Stockout Rate
Customer Acquisition Cost
Return on Advertising Spend
Average Order Value
Retention Rate
Beyond the store:
Unlocking the hidden value of retail’s halo effect
The halo effect explained – and why it matters now
A consumer’s shopping experience is no longer a linear journey. They browse and research products online, visit physical stores, engage on social media and buy through a brand’s website and wholesale distributors. For landlords and retailers, this means that physical stores influence much more than just in-store sales.
This reality is what has made measuring the ‘halo effect’ critical. But what exactly is it and how can retailers and landlords leverage it to make better location-based decisions and monetise store performance?
Defining the retail halo effect
The ‘halo effect’ is the contribution a physical store makes to online sales in its surrounding catchment.
A physical store plays a crucial role in brand building. If a customer is frequently reminded of your brand by passing your store while on their commute, they will be more likely to purchase from your brand online. Offering a distinctive brand experience will not only enable your physical location to drive online sales, but ensure your shelved products stand out to customers already spoiled for choice.
Ultimately, a strong physical store presence will enhance digital performance.
Why the halo effect is critical for retailers and landlords
Whether you are a retailer aiming to understand the true value of your stores or a landlord looking to attract the right tenants for your centre, being able to clearly measure how each store presence drives online revenue leads to better decision-making. As consumer behaviours evolve, understanding and quantifying this relationship has become crucial.
Making sense of the halo effect in practice
Viewing all channels as interconnected is necessary in modern retailing. By measuring the halo effect, you can understand exactly how a physical store’s presence will impact digital performance and where potential opportunities lie.
For landlords
When a tenant’s stores drive strong online sales in the surrounding area, engaged and high-spending shoppers are easy to attract to the broader retail destination as a result. Quantifying this cross-channel synergy helps you:
Draw a more precise picture of total revenue and brand impact
Understand how your physical presence influences your online revenue
Recruit the right tenant mix
Set fair rent expectations
For retailers
As a retailer, understanding the online revenue tied to a physical location will show whether a store is pulling its weight. If a location seems to have low in-store sales but a robust online halo, closing it might mean losing profitable online business. Being equipped with halo effect insights affects everything from site selection and store relocations to lease renewals and marketing investments.
The strategic impact of the halo effect
Insights from a physical store are more than just in-store interactions. They generate brand exposure that leads to online sales, which is where measuring the halo can be particularly useful in unlocking true value.
Refined network strategies: Attributing online sales back to store catchments offers you insight into exactly which locations are high performing.
Targeted investment: Depending on where the halo effect is seemingly strongest, you may opt for upscaling, refurbishing or increasing marketing around certain locations.
Risk management: Understanding the real online revenue at stake prevents costly mistakes before closing or relocating a store and that resources are allocated to areas offering the greatest return on investment.
Refined customer strategy: The online halo alone does not tell you whom to target, but reveals where your physical presence yields the biggest impact on online sales. Combining halo measurement with in-depth customer segmentation broadens strategic possibilities.
How CACI helps you measure and monetise the halo effect
By understanding the halo effect, you can improve location-based decision-making and discover the full picture of your interconnected physical locations and digital channels.
CACI helps retailers and landlords bring this to life. Our deep experience in shopper behaviour, demographic profiling and location analytics helps you extract meaningful insights from your halo measurements.
Our market insights ensure landlords understand where their tenants’ customers originate, who shops at specific locations and how to attract similar shopper profiles to other areas to improve tenant mix and increase footfall.
By layering the halo effect with demographic data, retailers can better assess where expansion or downsizing aligns with their target consumers’ shopping habits. Marketing campaigns can be tailored to amplify engagement and conversions across channels.
From understanding consumer catchment through Retail Footprint to evaluating online sales contributions via Brand Dimensions you can redefine the future of omnichannel retail, reassess investments and granularly view your stores’ performance.
How Darlington Borough Council used CACI data to promote their town centre & increase footfall
Summary
Darlington Borough Council, a local authority situated in a historic northeast England town with around 113,000 residents, sought to promote its vibrant town centre to increase footfall to its array of shops, restaurants, cafes and bars, encourage social congregation and strengthen the business community.
To achieve this, CACI produced a market summary report to help the Council better understand the demographic profile of Darlington’s shoppers and residents. The Council then used the resulting insights, which revealed £200m in retail spend, to position Darlington as one of the top shopping destinations within its catchment. The market summary report also predicted a further £650k in additional retail sales would be driven by an increase in Civil Service and professional services employees. This prompted the Council to approach larger retail, leisure and hospitality brands and encourage them to consider Darlington for their operations.
Company size
1,001 – 5,000
Industry
Non-Profit
Products and services used
Challenge
Darlington has a large town centre with an array of independent businesses alongside high street brands. However, with a number of well-known brands having ceased trading, rendering units empty and needing to be filled, the Council needed to understand which brands would best suit the town centre to attract the right mix of visitors to support the town centre’s businesses.
Historically, the Council made decisions based on gut feeling and local knowledge, such as assumptions on residents’ incomes and classifications, but lacked the metrics needed to evidence sentiment and investment.
Solution
Through CACI’s market summary report, Cllr. Chris McEwan, Deputy Leader and cabinet member for economy at Darlington Borough Council, shared how the Council gained clarity on how Darlington compares to other shopping locations.
“One of the standouts was understanding where we sit among other shopping locations,” he explained. “We are thought of as a smaller market town, but we measured up against the likes of Sunderland and Newcastle, and retail areas like the Metrocentre in Gateshead. That was lovely to see and something that we did not expect to come out of the data.”
These insights were also shared with local estate agents and commercial property agents to more effectively promote empty retail units and attract new retailers, contributing to the overall strengthening of Darlington’s town centre.
Results
The report challenged the misconception that certain north and northeast areas are deprived or lack affluence. According to Chris, it proved the contrary: “When we received CACI’s report, it was quite refreshing to see that we actually have quite an affluent population and there is a lot of untapped potential that could be utilised by some of the bigger brands.”
By identifying the best-suited locations for specific brands, the Council could adopt a more tailored, proactive strategy than just waiting for brands to approach them. This instilled confidence for the Council to showcase Darlington’s strengths as a destination and refine its focus on brands that would fit the demographic profile while validating the existing brand and tenant mix.
The findings showed that Darlington’s existing customer base closely aligns with some well-known brands, encouraging the Council to pursue an increased mix of big names to sit alongside their independent stores to continue increasing footfall. The depth of insight exceeded the Council’s initial expectations, particularly in being able to classify demographic groups and align them with brands.
While the focus for many local authorities is traditionally aimed at at-risk and vulnerable communities, CACI’s data offered the Council a broader view to help them understand how to help the wider community. A stronger local economy benefits everyone, creating a knock-on effect that also lifts those facing more challenging circumstances. An increase in jobs resulting from filling empty retail units could further drive numbers of people into the town centre.
Previously, the data available to the Council was limited and did not offer insights associated with available spend or potential additional spend. With CACI’s report, the Council could better understand the centre catchment area, where people shop and where they come to or from to shop again, demonstrating that despite a town being thought of as insular, people will travel if the retail and leisure offer is right. This insight informed complementary marketing resources designed to attract visitors to the town centre and provided a more innate understanding into how demographics and retail, leisure and hospitality brands align to create a more targeted, metrics-based approach for considering Darlington.
In the coming years, the Council aims to have more big brands on the high street and Darlington ranking even higher compared to other shopping destinations. A forward-thinking, proactive future is shaping up for the Council, having drawn up a list of desired retailers to initiate conversations with on coming to Darlington. In doing so, footfall increases across the board, the local economy is boosted, jobs are created for local residents, and a strong retail, leisure and hospitality offering is realised.
Testimonial
CACI’s report helped us confidently change perceptions to demonstrate that we are a town on the up… We’re trying to be more proactive and different… Having access to this data helps debunk myths and gets the right message out there
Chris McEwan
Deputy Leader and Cabinet Member for Economy at Darlington Borough Council
Testimonial
As a local authority, you can only do so much. There are things outside of our control. It’s trying to do as much as we can to promote the town… it’s finding ways in which we can stand out, which I think is significantly supported by data, answering the ‘why’.
Chris McEwan
Deputy Leader and Cabinet Member for Economy at Darlington Borough Council
Case Studies
Case Study
How CACI updated the Ocean consumer lifestyle database using AI techniques
This year’s MCA Food to Go conference unveiled the key growth drivers, future trends and exciting developments shaping the sector. It highlighted everything from innovative technology and formats to trendsetting menus and marketing, ultimately exploring how successful brands are navigating market challenges.
At the conference, I showcased transaction trends and growth opportunities emerging in 2026 based on three months of data from CACI’s Brand Dimensions dataset. By tracking 30+ food to go brands from November 2025 to January 2026, I assessed the trends and opportunities fuelling growth questions this year.
Here is what the data revealed.
Food to Go transaction trends & growth opportunities in 2026
The findings showed:
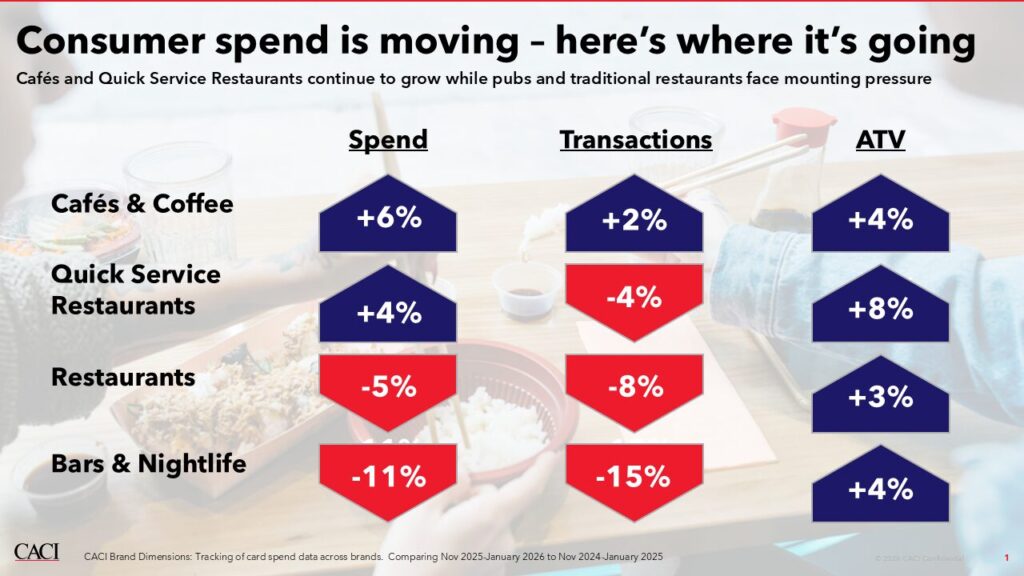
+6% YoY revenue growth in the Cafés & Coffee Shop market
A slight decrease in Quick Service Restaurant (QSR) transactions, but a slight increase in Average Transaction Value (ATV)
Transactions and revenue dropping across the wider F&B sector
Which brands are leading industry trends in 2026?
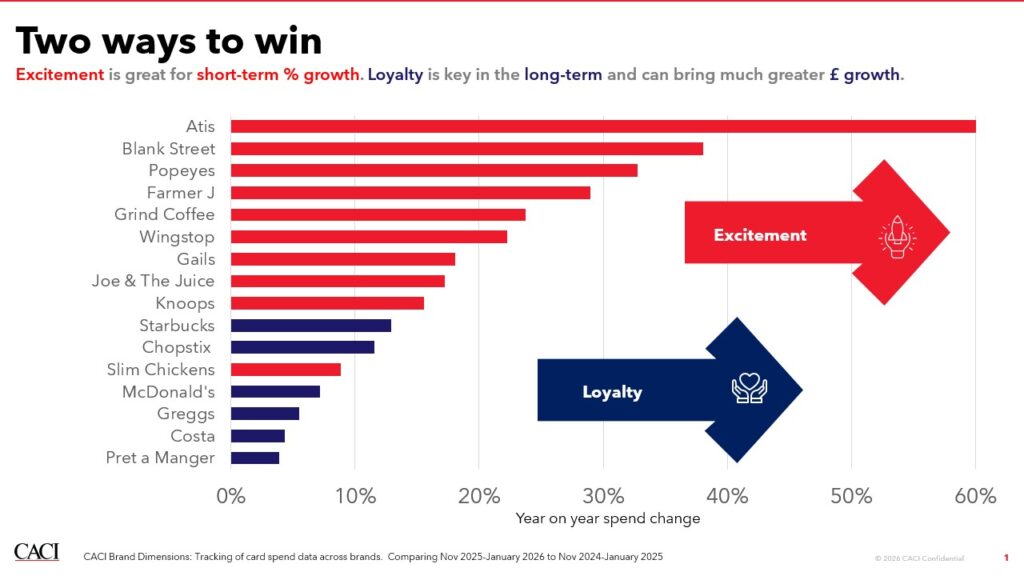
From the 30+ up-and-coming and major players in the food to go sector tracked, I identified the leading brands as those achieving YoY growth above inflation and sorted them by increase in growth percentage.
Premium healthy lunches: Atis & Farmer J
Consumers continue to prioritise premium healthy lunches this year.
The leading brands were Atis, growing 140%, and Farmer J, growing ~30%. Atis’ skyrocketing growth is driven by the opening of a third new space in the last year. While substantial and impressive, it is the smallest brand in CACI’s Food to Go tracker, meaning the overall GBP shift in the market is small.
The largest share of the customer mix for these brands comes from CACI’s Acorn profiles Prosperous Professionals at 15% of spendfollowed by Up-and-coming Urbanites at 11%.
For new entrants, the challenge to growth is proving value in each transaction, precise targeting and mission expansion without undermining the brand or cannibalising sales.
Continued growth in chicken QSR: Popeyes, Wingstop & Slims
Consumers continue to seek indulgence and novelty. In the chicken QSR sector, our findings concluded Popeyes grew ~30%, Wingstop ~20% and Slims ~9% (who were +46% in the first quarter of the year). While this may counter the premium healthy lunch trend, consumers are finding ways to balance health-conscious choices with indulgent ones.
Caffeine & matcha on the rise: Blank Street & Grind
Both Blank Street and Grind grew over 20%, indicative of the brands’ innovative products, strong social media presence and matcha-led menus. These brands have evidently appealed to younger, experience-driven consumers by creating excitement through their product innovation.
Established brands are driving growth by harnessing loyalty
The biggest takeaway is that while new entrants win on excitement, established brands win on loyalty.
New brands have brought excitement, and with that, percentage growth, but most saw YoY growth rates slow across the year. Meanwhile, more established brands like Pret a Manger, Costa, Starbucks and McDonald’s saw stronger growth in the latest quarter. When assessing actual pounds versus percentage growth, established brands are back growing and seeing very substantial sales gains. This reiterates the impact of loyalty on long-term growth.
The formula of the current state of the market then becomes:
New brands, social media influence and new cuisine are fuelling excitement. Loyalty is driven by familiarity, perceived value, brand resonance and communication. Brands that can achieve a sweet spot between both are poised for sustainable growth. However, our findings suggest tension between excitement and loyalty. This prompts brands to reflect on how to maintain excitement or build customer loyalty.
Four strategies to drive growth in a tough climate
1) Having the right products in place
Brands must understand how to appeal to existing customers and excite new ones. Product and menu innovation should be strategically considered to open new missions and tailor to the right locations, dayparts and missions.
2) Getting the right space
While growth can be achieved by acquiring new spaces, established brands are always optimising their spaces to reach the right people, in the right place, at the right time. This is why some brands are shifting to drive-through locations as town centres decline and why many have opted to offer FMCG products in the chilled sections of supermarkets.
3) Appealing to customers through the right message
Tailored content sent to the right target group at the right time with the right incentive is critical to success.
4) Delivering with the right service
Profitably staffing each location, determining which locations will best suit trialling self-service kiosks and avoiding alienating or upsetting customers who value your brand’s personal service are critical considerations.
This is often easier in the new entry “excitement” phase, but new and established entrants must constantly evaluate that they have the right mix of these factors to remain relevant in a rapidly changing market. Each of these strategies has a ‘people, place and time’ lever that can be pulled to maximise growth by leveraging customer loyalty.
How CACI’s Brand Dimensions can help your Food to Go business thrive
With so much complexity in the food to go sector, brands need more than just internal customer data to keep on top of the mix. Supplementary market data through CACI’s Brand Dimensions can help you answer your growth questions, combining the right data with the right tools to project long-term growth through the right mix of products, services, places and messaging.
Highly detailed, timestamped transaction data is at the heart of Brand Dimensions, indicating anonymised customers and specific outlets to infill any data gaps and gain unique performance and competitor outlet insights.
When combined with anonymised mobile activity data and demographic classifications, it creates a cohesive base to address the people, place and time levers driving growth. This can also be topped off with lifestyle attributes linked to those demographics, competitor location data and competitor sentiment data.
Through this, businesses can better prepare for the future by understanding consumer behaviour at brand level.
Although Brand Dimensions is typically tracked on a monthly basis, these findings have been summarised quarterly for this blog.
If your brand could benefit from these data insights, book a Brand Dimensions demo with us.
Case study
How Landsec leverages Acorn to elevate their consumer understanding
Summary
Landsec identifies and shapes places that create opportunity, enhance quality of life and bring joy to people connected to them. This is how they’ve created and become the UK’s leading portfolio of urban places and one of the largest real estate companies in Europe. Their £10 billion portfolio is built around premium workplaces, the country’s pre-eminent retail platform with an annual footfall of circa 130,000,000, and a residential platform that will redefine urban life. CACI works with Landsec as a strategic partner, delivering data and insights to support the business’s data strategy and key decision-making. This includes transaction data to better understand consumer spending behaviours based on online and offline shopping patterns, Location Dynamics for a comprehensive view of the retail landscape across the UK and Acorn to provide a socio-economic lens to consumers and their respective catchment areas.
Key questions that have been addressed as part of this have included where consumers come from, catchment penetration (the number of consumers being reached and converted) and consumers’ spending behaviours. This has enabled Landsec to understand the performance of marketing and leasing decisions, identify consumers that have re-engaged, and assess how to influence future behaviours.
Company size
500 – 1,000
Industry
Real estate
Products used
Challenge
As Landsec puts the consumer at the heart of their decision-making, they needed a persona-specific project that would offer an additional layer of relevant internal business insight into why consumers visit Landsec’s retail destinations. This additional layer would not only unify all overarching datasets and findings but bring Landsec’s consumers to life. This granular insight would provide a crucial understanding of what makes them tick, how best to reach them, how to grow their engagement and what new offerings or activations would encourage them to visit Landsec’s destinations more. This provides a tool for helping the business to understand target consumers. With this enhanced insight, Landsec can more effectively position the asset and better align communications to ultimately drive the success of their retail destinations.
Solution
CACI first conducted a national representative survey to better understand consumers’ shopping habits, motivations for visiting retail centres and how they research and consume information about their shopping destinations or brand updates. These results were then appended to CACI’s geodemographic segmentation, Acorn, enriching the core Acorn groups and bringing them to life to provide a ’Landsec shopper’ lens. CACI included wider datasets such as Brand Dimensions to understand relevant brand alignment and spending behaviours (including online and offline shopping behaviours). The resulting personas have equipped Landsec with an enhanced consumer understanding and crucial information for targeted marketing campaigns, internal strategy planning, leasing decision-making and wider brand placement. Furthermore, underpinning these personas with the Acorn structure has allowed Landsec to bridge them across all other datasets.
According to Vanessa Luen, Insights Director at Landsec, these personas “brought consumers to life” by identifying the profiles – and ultimately the needs and preferences – of individuals. This shopping-specific lens is helping the business better understand how consumers spend and engage with specific brands from a qualitative perspective.
Dan Wharton, Marketing Director at Landsec, elaborated on the impact that “humanising” data through the consumer personas has had on the wider business.
“Across our business, we had a broad interpretation of what the cold data or demographic terms were. I think this has given far more of a laser focus of who that consumer is and how we should go about attracting them to our destinations, which is fundamentally what we’re interested in and makes life a lot more humanised in terms of internal communication and in briefing agencies when it comes to our creative positioning,” he explained. “Since the personas are so robust and detailed, it really supports us in the work that we do.”
These personas have also augmented Landsec’s digital activation briefings for their creative agencies, ensuring that outputs are tailored to the right target audiences, with the right message, in the right channel, appealing to new and potential tenants alike.
Results
This initiative has helped Landsec better understand consumers’ sentiments towards different marketing channels, ultimately guiding their CRM proposition and strategic decision-making away from investing in the development of an app.
“There was a specific piece of data on the use of apps that actually directed where we went with our CRM proposition,” Dan explained. “It’s very expensive to do apps and what we found was that it wasn’t that important to the customer to have an app through those personas. So, it has started to guide strategic decision making.”
What began as an initiative to better understand Landsec consumers has led to the development and integration of these personas into the existing CRM database and a data-driven deliverable that has been well received across the wider business and agencies alike. While their application in campaigns and integration into Landsec’s existing brand proposition are still in early days, the team is confident that the personas will bolster their strategic planning capabilities. According to Vanessa, CACI’s strategic and competitor knowledge took the development of these personas to the next level.
Appending the Acorn segmentation and different attributes along with survey results has also enabled Landsec to build out more personalised and relevant content. Linking results to Acorn profiles enriched the insight, offering a deeper understanding of consumers and how best to engage with them.. Going forward, adopting a business-wide culture with the Landsec consumer remaining at the heart of everything they do is key for Vanessa, particularly with ongoing support from CACI.
“I think CACI is a huge part of that, not just on the personas, but the data that we purchased in terms of understanding our consumer, the potential even on our development assets as well,” she shared.
For Dan, it’s building on the foundations of this work and creating a single source of truth across the business rather than multiple interpretations built on disparate datasets.
“What’s key for us is having alignment of who that consumer is, what value we can bring to them across Landsec, and where the opportunity is to drive further,” he added.
Testimonial
One thing I love about CACI is that you have the expectation, you know our business, but if there’s something that we want to shift or pivot on, you’ll be very flexible, adaptable and you can pre-empt a lot of the things that we might have to question or ask about if we were to do with a different provider. You understand what competitors or strategic partners do within the industry to help ensure that we’re using the most optimised view for our projects.
Vanessa Luen
Insights Director at Landsec
Case Studies
Case Study
Using Acorn to improve road safety interventions & outcomes
From weight loss medication and fertility support to cosmetic and hair loss treatments, the traditional elective healthcare landscape is being radically transformed.
Historically, elective healthcare might have been associated with older demographics or specific medical needs. However, recent insights from CACI’s Voice of the Nation (VOTN) consumer survey reveal a compelling shift: a surge in demand for elective treatments from wellness and image-conscious Gen Z and Millennial consumers.
This fundamental change has profound implications for healthcare providers and their location strategies to ensure they are precisely aligned with the evolving demographics of their target audiences and meet their notably high expectations around convenience, accessibility, and experience. This offers a huge challenge – and opportunity – for healthcare brands to adopt a more agile, data-informed approach to their physical presence.
A complex convergence of health, wellness and beauty consumption
Our Voice of the Nation (VOTN) survey reveals that weight-loss treatments like Mounjaro and Ozempic are projected to grow by 40% in 2025, with Millennials and Gen Z leading the charge. And Gen Z show equal interest among both male and female respondents unlike all other age cohorts, where women predominate.
And while 4.9% of respondents overall say they plan to pay for cosmetic treatments in 2025, this number rises above 10% for Gen Z respondents and female Millennials but remains below 3% for anyone older than 45.
It might be tempting to assume that this trend is purely about aesthetics. And there’s some truth in this. For those planning to increase their beauty spending in 2025, nearly 14.9% planned to pay for cosmetic treatment against 4.9% generally. Similar jumps were seen for hair loss treatment (10.2% versus 3.3% generally) and weight loss services (14.9% against 6.4% generally).
Yet other issues are also in play.
For Gen Z respondents who considered ‘Health’ as a top three issue facing the UK, there was also a distinct increase in planned treatments: 16.2% of Gen Z males concerned about health were planning weight loss treatments versus 9.7% in general, for example.
In addition, when we look at the Voice of the Nation sentiment data through our in-depth Acorn geodemographic segmentation, demand for all types of healthcare treatments spans both affluent and less affluent groups.
Brought together, the data shows there’s a truly complex mix of motivations — from aesthetics and wellness to proactive health management – across and within different age cohorts. But all with the clear underlying message that Millennials and Gen Z with their growing spending power are seriously invested in elective healthcare treatments that make them feel and look better.
Why Traditional Site Selection Falls Short
Historically, location planning in healthcare has relied on broad demographic assumptions or legacy performance data. But in today’s market, that’s not enough, no longer can site selection be based on general market trends. A clinic with the wrong treatment offer, placed in the wrong area – too far from its target audience, or in a location with low footfall – can struggle to gain traction, regardless of the quality of care it offers.
But critically, it’s not just about what these consumers want — it’s about where they are. Something that after Covid-19 has also changed. Traditional assumptions about most people working from the office every day no longer hold. Our VOTN research found that on average people now only spend on average 2.5 days in the office – Gen Z spending 12.5% more time in the office than Gen X and Baby Boomers.
Younger generations are more likely to live in urban centres, commute via public transport, and expect services to fit seamlessly into their daily routines. This is reflected in our VOTN data which finds Gen Z less likely to have products delivered to home and far more likely to have purchases delivered to a pick-up/drop off point like a locker or local convenience store (39% versus 23% in general) or delivered to a convenient location like their office (27% versus 14% in general).
And as we’ve already noted younger generations are also more likely to pay for treatments where the NHS is not offering what they need or on the timescale they want it.
What’s needed is a more granular, predictive approach to location choice: one that considers not just who your customers are, but how they move, spend, and engage with products and services.
A data-driven bespoke approach to Location Strategy
Healthcare treatment providers looking for physical locations that will help them match this complexity of demand and grow their business should be looking to modern location analytics that combine powerful human behavioural and geographical insights. Rather than taking an ‘off-the-shelf’ approach that can obscure what’s really going with the new healthcare consumer, a bespoke approach allows you to:
Map journey-time decay to understand how far patients are willing to travel for different services
Define profile catchments using lifestyle segmentation like our CACI Acorn that can leverage over 700 economic, behavioural and social variables to identify over-represented consumer types in particular areas
Overlay footfall and spend data to assess the commercial viability of potential sites
Unlock ‘white space’ by using location analytics such as provided by our Location Dynamics to identify areas with unmet demand and minimal competition
Rank postcode sectors by indicators like Private Medical Insurance coverage or self-pay propensity
The future of healthcare location strategy
The rise of younger, self-directed healthcare consumers who value their physical and mental wellbeing is clearly not a passing trend – it’s a structural shift. To stay relevant, providers must meet these audiences where they are – both physically and emotionally, including as they ‘age’ into other services like fertility, hair loss treatments and joint replacements.
To truly capture this growing segment, providers must harness advanced data to pinpoint and predict high-potential areas where these new consumers live, work, and spend. This ensures that every new clinic, every re-evaluated existing site, is positioned for maximum impact, catering directly to the evolving needs and preferences of a generation redefining elective health. That means rethinking location strategy as a core part of business planning, not just an operational detail. With the right data and tools, healthcare brands can build a physical location footprint that’s not only efficient for today, but also future-proof.
To find out how we can help you find the healthcare consumers best suited to your services, get in touch with us.
How CACI helped Merry Hill assess the benefits of an M&S refurbishment
Merry Hill is one of the largest regional malls in the UK, encompassing over 200 shops such as major flagships Primark, M&S and Next. Sovereign Centros from CBRE were appointed asset managers of the former Intu asset in 2022, and have since expanded the retail, F&B, and leisure offering, with recent high profile openings including Hollywood Bowl and national debuts for Harvey Norman and XF Gym.
When Merry Hill chose to invest in renovating the M&S flagship store, they needed to quantify the impact changes would have on performance. This required a robust simulation of the future turnover and resulting footfall. In this blog, we uncover the steps that CACI took to help Merry Hill understand the impact of refurbishing M&S and gain investors’ approval to execute it.
How CACI evidenced outcomes of refurbishing Merry Hill’s M&S
CACI compiled a report covering an overview of M&S’ current performance, the impact of a refurbishment on the retailer’s turnover and the cross-shopping potential it could bring across Merry Hill. The report also considered factors such as benchmark centre sales where M&S had already been upgraded, annual trips to Merry Hill should the refurbishment not take place, and potential customer loss to Bullring & Grand Central mall where a new M&S was due to open.
The data sources included in CACI’s report were:
Transactional Spend Data: Derived from real-world debit card spend data from multiple sources, Transactional Spend Data is a fully consented view of spending patterns. It offers granularity into how different groups interact and how customers engage through an analysis of spend by product category.
Acorn: CACI’s consumer segmentation model combines geography with a variety of demographics and lifestyle data sources, grouping the entire population into 6 Categories, 18 Groups and 62 Types. It supplies insights into the role that demographics plays in impacting the performance of a location and helps identify key users of a site.
Location Dynamics: CACI’s machine learning tool predicts the retail, grocery and leisure catchments of over 6,000 destinations in the UK. It considers underlying population and spend, competitive landscapes and accessibility to each destination to model overlapping catchments. In this context, Location Dynamics was used to predict the centre’s performance, and overlap with Birmingham city centre, allowing for a comparison to actual sales to understand where and how the centre could grow turnover.
Brand Dimensions: CACI’s benchmarking tool tracks the performance of 300 major brands over time. In this instance, it examined M&S spend performance nationally and at benchmarked locations.
What value would refurbishing Merry Hill’s M&S bring?
Having been at Merry Hill for three decades, investing in a refurbishment of M&S would solidify its continued commitment to the centre.
Increase in average spend, dwell time & turnover
CACI uncovered that centres with a refurbished M&S store have seen an increase in average spend per head in benchmark centres by 2.2%, which could help generate a substantial turnover at Merry Hill. With M&S accounting for 11% of centre floorspace at Merry Hill, improving its appearance could impact the ambience of the rest of Merry Hill and contribute to an uplift in dwell time, retail spend, and catering for the wider centre. Refurbishing Merry Hill’s M&S would also accelerate turnover at both the store and across the centre, as refurbishment is cited as a key factor for increasing sales.
Appealing to younger, more affluent demographic
Our research has shown that refurbished stores tend to attract younger, more affluent shoppers. While Merry Hill’s diverse shopper profile of Executive Wealth, Mature Money, and Steady Neighbourhoods Acorn groups is well aligned to key shoppers for M&S, key groups have all under performed versus catchment expectation. A refurbished M&S would appeal to these underperforming visitors.
A reported 82% of M&S shoppers also go on to spend in other stores at Merry Hill. Therefore, the new footfall that a refurbished M&S would attract would benefit other tenants in the centre.
Sales growth from new & existing shoppers
Within this project, we were able to quantify the number of new Merry Hill visitors that would be generated as a result of the refurbished M&S, with considering factors including their potential spend in M&S and their spill-over expenditure across the wider centre.
Graeme Jones, Executive Director at Sovereign Centros from CBRE: “M&S has been a big part of Merry Hill for several decades, so any decision about their future is one that needed to be made with real consideration of the potential impact on the destination. When we decided that we wanted them to introduce their latest shop fit, while consolidating from two units into one to create new opportunities, we started to create a proposal for M&S that would make the best possible case for a significant investment commitment. The data and insight from CACI was a crucial element of that business case, emphasising the rationale from a visitor, brand, and landlord perspective. It helped achieve a positive outcome for all parties, and the new M&S store is already beating commercial targets, and has had a big impact on Merry Hill and its visitor numbers.”
Ellie Brettell, Senior Property Consultant at CACI: “We’re increasingly being asked to support decisions like this one, where significant investment is involved and multiple parties need reassurance that the right choice is being made. Our objective, data-driven approach helps provide that clarity. Our contribution to this fantastic deal for Merry Hill was possible because of our expertise working for brands and owners of places – we understand the goals and potential impacts on both sides and can therefore create a report that rationalises a decision for all parties. Our evidence base made it clear that this deal would create positive outcomes for everyone involved, so naturally we’re proud that our work has helped to deliver such tangible success.”
How CACI can help
The insights provided through CACI’s report instilled both internal and external stakeholders with the necessary confidence to make significant investments in the refurbished M&S. To learn more about our products and data available from key partners to generate a single view of the UK property market, contact us today.
Case study
Driving performance through the Centre Growth Model
Summary
CACI has long advised its retail property clients on strategies to grow sales and footfall at their assets. The Centre Growth Model combines CACI, client and third-party dataset to give clients a clear direction on how, where and who to grow sales from across their customer base.
Industry
Property
Services used
Centre Growth Model
Challenge
CACI property clients need to grow customer sales at their retail destinations (e.g. regional malls, retail parks, outlet centres) to increase the value of their assets. Understanding how often a customer visits, how much they spend on a visit, and who doesn’t visit (but should), versus the performance of peer group locations allows clients to understand what good looks like, where to improve, and ultimately settle on the most appropriate strategy for growth.
Clients need to understand customer behaviour and benchmark against peers to develop effective growth strategies.
The Centre Growth Model combines various datasets to guide clients on growing sales and footfall.
The model uses geographic and demographic data to identify growth opportunities and optimize marketing efforts
Solution
Strategies for customer growth can be complex and will vary through both geographic location (how far away a shopper is from a retail destination) and demographic and economic factors (how much discretionary spend they have available).
The Centre Growth Model takes these complex issues into account and converts them into three simple metrics to drive growth:
getting existing shoppers to spend more
getting existing shoppers to visit more frequently
getting new shoppers to visit the asset
By analysing geographic and demographic data, the model identifies the best growth opportunities. It compares client assets to benchmark retail locations to understand areas of over and underperformance, providing targeted guidance for leasing and marketing activities to achieve maximum impact.
Results
By leveraging the Centre Growth Model, our clients can now confidently pinpoint customers and geographies that offer the greatest potential for growth in both turnover and footfall. This insight enables them to strategically focus their marketing efforts on high-impact zones, ensuring optimal return on investment whilst also avoiding unnecessary spend in less effective areas.
Case studies
Case Study
Developing an understanding of individual members to win new business
Republic Technologies maximises ROI from its field sales team
Summary
Republic Technologies is a global consumer goods company with over 100 years of manufacturing history. In the UK, its products are sold in a multitude of retail settings including newsagents, supermarkets and convenience stores, and requires a traditional field sales force. Republic Technologies wanted to improve its operations and geographic deployment in the field to ensure it had the right people in the right place to optimise sales teams’ working patterns, growth and customer service.
Company size
100
Industry
Manufacturing
Products used
Challenge
Republic Technologies had a number of vacancies in its field sales team, but did not know the best places to recruit. Nor did Republic Technologies know whether it needed to fill all these vacancies. Could it scale the team back and still achieve its target call rate?
Republic Technologies’ territories were imbalanced, with some people working far more hours than others. The team was spending too much time driving. Republic Technologies wanted to optimise the territories to ensure that each person was working the same hours and maximise the time spent with customers.
Based on the anticipated changes to the territories, Republic Technologies wanted to provide each sales person with a plan of attack to help them get around their customers in the most efficient way.
Solution
CACI worked with Republic Technologies’ field managers to address these challenges. Using CACI’s proprietary InSite software, we started with headcount analysis and employed InSite’s travel time algorithm to understand the amount of driving the field team would have to make between calls. This helped to understand exactly how many hours the current team was working and what this would look like if the headcount changed. Based on these calculations the correct team size was established, giving Republic Technologies the confidence that it had struck the right balance.
From this optimised structure, CACI used its CallSmart route optimiser to deliver a set of efficient routes for each field sales rep.
Results
CACI’s work has allowed Republic Technologies to quantify the hidden work in a sales person’s day to truly understand the correct size of their field sales team. This ensured Republic Technologies was maximising the return on investment from this team.
The territory optimisation improved the balance of work across the team and reduced the amount of time spent driving. With this enhanced efficiency, Republic Technologies was able to focus its recruitment on better defined locations, filling vacancies more effectively in more targeted areas. Another benefit of this was a reduction in fuel bills.
The routing gave each sales person a daily sequences of visits that reduced the time they spent in the car and the time they spent planning.
Testimonial
We have worked with CACI for several years now. Overall we have found their services invaluable and have managed to complete field sales team changes in very little time. On the most recent brief the changes were up and running in no time at all with the output requiring very few manual tweaks. Good job.
Gavin Anderson MISM
General Sales Manager, Republic Technologies
Case studies
Post not found.
Case Study
Agile field force planning for a leading US retail merchandising specialist