
The quick service restaurant (QSR) sector is entering 2026 at a pivotal moment. Consumer demand remains resilient, but the operating environment is more complex than at any point in the last decade. Inflationary pressures, labour shortages, evolving customer expectations and rapid technological change are forcing QSR leaders to make sharper, more evidence-based decisions.
While much has been written about emerging QSR trends, many articles stop short of answering the most important question: which trends will genuinely deliver sustainable growth, and which risk becoming costly distractions?
In 2026, success will depend less on adopting every new innovation and more on prioritising the right initiatives, in the right locations, for the right customers, underpinned by strong data foundations.
Why QSRs can’t afford to ignore these trends
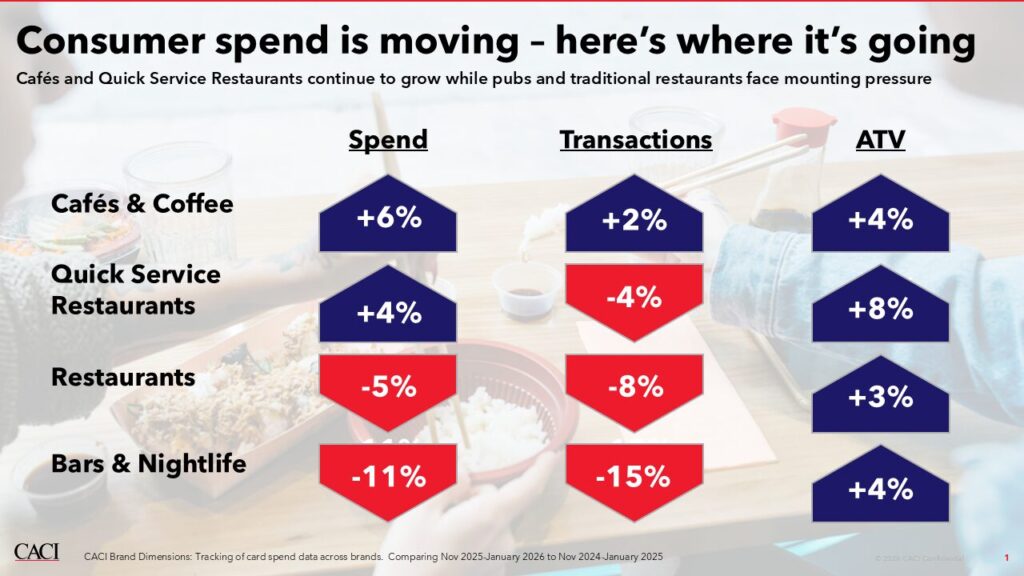
Globally, the QSR market continues to grow, but that growth is increasingly uneven. According to market analysis of the UK foodservice sector, total market value is forecast to exceed £85bn by 2026, with growth driven largely by QSR and delivery-led formats.
However, this growth masks significant pressure beneath the surface:
- Labour and food inflation have increased operating costs by 20–30% since 2019, according to hospitality cost analysis and UK inflation data.
- More than 50% of UK consumers report actively cutting back on discretionary spending, including eating out.
- Digital interactions now influence the majority of QSR transactions, from mobile ordering and kiosks to loyalty and payment.
Against this backdrop, trends are not abstract ideas — they directly influence network planning, pricing strategy, menu development and customer experience. Brands that understand how these trends play out locally are far better positioned to protect margins and unlock sustainable growth.
Top 7 quick service restaurant trends for 2026
1. AI as a strategic engine, not just a technology layer
Artificial intelligence has moved well beyond experimentation in QSR. In 2026, AI is increasingly embedded across forecasting, pricing, labour scheduling and customer engagement.
Academic and industry research shows that machine-learning-based demand forecasting can reduce forecast error by up to 52%, directly lowering waste and improving operational efficiency.
Additional industry analysis highlights that AI-enabled forecasting can reduce food waste by up to 25%, improving both sustainability and margins.
However, the biggest gains come when AI is treated as a strategic capability, not a bolt-on. Without high-quality customer data, location insight and behavioural context, AI risks reinforcing inefficiencies rather than resolving them.
What leading QSRs are doing differently:
Rather than deploying AI in isolation, leading QSRs are focusing on strengthening the data foundations that sit behind it. This includes improving customer data quality, linking transactional and behavioural signals, and incorporating location-based context into forecasting models. As a result, AI is increasingly used to anticipate demand, optimise decision-making and reduce operational risk, rather than simply automate existing processes.
2. Drive-thru reinvention: speed, accuracy and experience
Despite the growth of delivery and mobile ordering, the drive-thru remains the backbone of the QSR model. Industry analysis consistently shows that drive-thru accounts for nearly 75% of QSR sales in mature markets.
Key developments shaping 2026 include:
- Voice AI reducing average order time by 20–30 seconds per vehicle
- Increased use of queue analytics to manage peak-time congestion
Crucially, hospitality research shows that order accuracy and perceived friendliness have a greater impact on repeat visits than speed alone, reinforcing the need for balanced optimisation.
What leading QSRs are doing differently:
Top-performing QSRs are moving away from uniform drive-thru solutions and instead optimising performance at a local level. By analysing demand patterns by site, time of day and customer mix, they are better able to balance speed, accuracy and service quality. This approach helps direct investment towards the locations and peak periods where improvements deliver the greatest return.
3. Omnichannel ordering and digital transformation (with loyalty at the core)
By 2026, omnichannel is no longer a differentiator — it is an expectation. Customers move seamlessly between apps, kiosks, drive-thru and delivery platforms.
Industry data highlights that:
- Customers engaging across three or more channels are 2.5x more valuable than single-channel customers.
- Loyalty members account for over 70% of digital QSR revenue at leading brands.
The challenge lies in orchestration. Fragmented systems and disconnected data undermine both margin and experience. Leading QSRs are investing in a single customer view, unifying transaction, behavioural and location data to understand which channels genuinely drive incremental value.
What leading QSRs are doing differently:
Rather than treating channels independently, leading QSRs are building a more integrated view of the customer journey. By connecting data across mobile, in-store, drive-thru and delivery platforms, they gain clearer visibility of true customer value and channel interaction. This enables more consistent experiences, better-targeted loyalty strategies and improved understanding of which channels drive incremental growth.
4. Value-driven strategies in a cost-conscious market
Value has re-emerged as one of the defining QSR trends of 2026. According to UK consumer research, more than half of consumers actively compare prices before choosing where to eat.
Additional findings show that:
- Bundled meals increase average order value by 8–12%
- Limited-time offers drive trial without permanently eroding price perception
The most effective value strategies are location-specific, using data to tailor pricing and promotions to local demographics, competition and demand patterns.
What leading QSRs are doing differently
Instead of relying on national price promotions, leading brands are taking a more nuanced approach to value. By analysing local demographics, competitive intensity and purchasing behaviour, they are tailoring offers and bundles to specific markets. This allows them to respond to price sensitivity where it exists, while avoiding unnecessary margin erosion in locations where demand is more resilient.
5. Sustainability and packaging innovation
Sustainability is now a baseline expectation rather than a differentiator. Research indicates that over 75% of consumers expect QSR packaging to be recyclable or compostable.
Industry data also shows:
- Packaging redesigns can deliver 10–15% material cost savings
- Food waste contributes 8–10% of global greenhouse gas emissions, increasing pressure on operators to reduce waste
What leading QSRs are doing differently:
Leading QSRs are embedding sustainability into operational decision-making rather than treating it as a standalone initiative. By monitoring waste, packaging usage and customer response at a granular level, they are able to test changes, measure outcomes and scale successful approaches. This data-led approach helps balance environmental goals with operational efficiency and cost control.
6. Health, wellness and radical transparency
Health-led eating continues to influence QSR menus. Consumer studies show that over 40% of UK consumers actively seek healthier options when eating out.
Protein-forward and plant-based items continue to outperform category averages, while demand for clear nutritional and allergen information grows.
What leading QSRs are doing differently:
Rather than expanding menus uniformly, leading operators are using customer insight to understand how demand for healthier options varies by location and occasion. This allows them to introduce targeted menu changes, refine portion sizes and improve transparency without adding unnecessary complexity. The result is a more relevant offer that reflects local preferences while maintaining operational simplicity.
7. Ghost kitchens and virtual brands: a more disciplined model
Ghost kitchens remain relevant, but success depends on precision. Market analysis shows that location selection and demand modelling are the biggest determinants of virtual brand success.
Virtual brands are increasingly used to:
- Extend trade area coverage
- Test new concepts with lower capital risk
- Optimise delivery economics
What leading QSRs are doing differently:
Successful operators are taking a more analytical approach to virtual brands and ghost kitchens. By combining demand forecasting, delivery radius analysis and competitive mapping, they are identifying opportunities that complement existing estates rather than cannibalise them. This disciplined use of data reduces risk and improves the likelihood of sustainable performance.
How QSR leaders can act on 2026 trends today
Understanding trends is only half the challenge. The real differentiator is execution.
To translate 2026 trends into commercial advantage, QSR leaders should focus on five practical steps:
1. Prioritise trends by impact, not hype
Not every trend will matter equally to every brand. Use data to assess which initiatives will:
- Drive incremental demand
- Improve operational efficiency
- Strengthen customer loyalty
2. Ground innovation in customer insight
Customer expectations vary significantly by location, demographic and occasion. Advanced segmentation and behavioural analysis help ensure investment aligns with real demand.
3. Use location intelligence to guide decisions
From drive-thru optimisation to ghost kitchens, place matters. Understanding trade areas, cannibalisation risk and local competition reduces costly mistakes.
4. Test, learn and scale
Pilot new formats, offers and technologies in controlled environments. Measure results rigorously before national rollout.
5. Build a strong data foundation
Unified, high-quality data underpins every successful trend — from AI to personalisation to sustainability.
Future outlook: what comes next?
Looking beyond 2026, the QSR sector will continue to converge with retail and digital commerce. Automation will increase, but human service will remain critical. Data will become more central — not just for optimisation, but for resilience.
The brands that outperform will be those that:
- Invest in insight, not just infrastructure
- Optimise locally, not just nationally
- Align innovation with measurable commercial outcomes
In a volatile environment, clarity beats complexity — and data-led decision-making is the most reliable route to sustainable growth.
Frequently asked questions about QSR trends for 2026
What are the top quick service restaurant trends for 2026?
The top quick service restaurant trends for 2026 include AI-driven operations, drive-thru optimisation, omnichannel ordering, value-led pricing strategies, sustainability-focused packaging and data-driven personalisation. These trends reflect rising cost pressures, digital adoption and changing consumer expectations across the QSR sector.
How is AI being used in quick service restaurants?
AI is used in quick service restaurants to improve demand forecasting, labour scheduling, order accuracy and personalised marketing. By 2026, many QSRs use AI to reduce food waste, optimise staffing and deliver more relevant customer offers in real time.
Why is value such an important trend for QSRs in 2026?
Value is a key QSR trend in 2026 because consumers are more price-conscious due to ongoing cost-of-living pressures. Quick service restaurants are responding with targeted value meals, bundles and promotions that balance affordability with profitability.
Are ghost kitchens still relevant in 2026?
Yes, ghost kitchens are still relevant in 2026, but they are used more selectively. QSR brands now rely on demand modelling, delivery radius analysis and location intelligence to ensure ghost kitchens are commercially viable.
What role does data play in QSR trends for 2026?
Data plays a central role in QSR trends for 2026 by enabling better decision-making across pricing, site selection, customer engagement and operations. Brands that integrate customer, transaction and location data are better positioned to adapt to market changes.
How can quick service restaurants prepare for the future beyond 2026?
Quick service restaurants can prepare for the future by investing in strong data foundations, customer insight and flexible operating models. This allows QSRs to test new concepts, optimise locations and respond quickly to evolving consumer behaviour.