Posts Beyond the store: Unlocking the hidden value of retail’s halo effect

Beyond the store: Unlocking the hidden value of retail’s halo effect

In this Article

The halo effect explained – and why it matters now

A consumer’s shopping experience is no longer a linear journey. They browse and research products online, visit physical stores, engage on social media and buy through a brand’s website and wholesale distributors. For landlords and retailers, this means that physical stores influence much more than just in-store sales. 

This reality is what has made measuring the ‘halo effect’ critical. But what exactly is it and how can retailers and landlords leverage it to make better location-based decisions and monetise store performance?  

Defining the retail halo effect

The ‘halo effect’ is the contribution a physical store makes to online sales in its surrounding catchment. 

A physical store plays a crucial role in brand building. If a customer is frequently reminded of your brand by passing your store while on their commute, they will be more likely to purchase from your brand online. Offering a distinctive brand experience will not only enable your physical location to drive online sales, but ensure your shelved products stand out to customers already spoiled for choice.  

Ultimately, a strong physical store presence will enhance digital performance. 

Why the halo effect is critical for retailers and landlords

Whether you are a retailer aiming to understand the true value of your stores or a landlord looking to attract the right tenants for your centre, being able to clearly measure how each store presence drives online revenue leads to better decision-making. As consumer behaviours evolve, understanding and quantifying this relationship has become crucial. 

Making sense of the halo effect in practice

Viewing all channels as interconnected is necessary in modern retailing. By measuring the halo effect, you can understand exactly how a physical store’s presence will impact digital performance and where potential opportunities lie.

For landlords

When a tenant’s stores drive strong online sales in the surrounding area, engaged and high-spending shoppers are easy to attract to the broader retail destination as a result. Quantifying this cross-channel synergy helps you:  

  • Draw a more precise picture of total revenue and brand impact 
  • Understand how your physical presence influences your online revenue  
  • Recruit the right tenant mix 
  • Set fair rent expectations

For retailers

As a retailer, understanding the online revenue tied to a physical location will show whether a store is pulling its weight. If a location seems to have low in-store sales but a robust online halo, closing it might mean losing profitable online business. Being equipped with halo effect insights affects everything from site selection and store relocations to lease renewals and marketing investments. 

The strategic impact of the halo effect

Insights from a physical store are more than just in-store interactions. They generate brand exposure that leads to online sales, which is where measuring the halo can be particularly useful in unlocking true value. 

  • Refined network strategies: Attributing online sales back to store catchments offers you insight into exactly which locations are high performing.  
  • Targeted investment: Depending on where the halo effect is seemingly strongest, you may opt for upscaling, refurbishing or increasing marketing around certain locations.  
  • Risk management: Understanding the real online revenue at stake prevents costly mistakes before closing or relocating a store and that resources are allocated to areas offering the greatest return on investment. 
  • Refined customer strategy: The online halo alone does not tell you whom to target, but reveals where your physical presence yields the biggest impact on online sales. Combining halo measurement with in-depth customer segmentation broadens strategic possibilities. 

How CACI helps you measure and monetise the halo effect

By understanding the halo effect, you can improve location-based decision-making and discover the full picture of your interconnected physical locations and digital channels. 

CACI helps retailers and landlords bring this to life. Our deep experience in shopper behaviour, demographic profiling and location analytics helps you extract meaningful insights from your halo measurements.  

Our market insights ensure landlords understand where their tenants’ customers originate, who shops at specific locations and how to attract similar shopper profiles to other areas to improve tenant mix and increase footfall.  

By layering the halo effect with demographic data, retailers can better assess where expansion or downsizing aligns with their target consumers’ shopping habits. Marketing campaigns can be tailored to amplify engagement and conversions across channels. 

From understanding consumer catchment through Retail Footprint to evaluating online sales contributions via Brand Dimensions you can redefine the future of omnichannel retail, reassess investments and granularly view your stores’ performance.  

Contact our experts today to find out more. 

What is website sprawl costing your organisation & how consolidation can help

In this Article

In our first blog of our ecosystem orchestration series, we explored why fragmented platforms may be holding your organisation back and how to navigate them through ecosystem orchestration. In this blog, we uncover the signs of website sprawl arising, how it may be affecting your organisation, the hidden costs of these signs and how consolidation can help mitigate them. 

Website estates rarely sprawl and fragment overnight. The gradual accumulation of websites is often the result of growth through business acquisitions or new sites being launched for different departments, products, campaigns or geographical regions. Each new site introduces its own hosting, security requirements, content workflows and maintenance demands.  

Over time, what may once have seemed like manageable expansion becomes a complex web of disconnected platforms, duplicated content, siloed data and rising operational overheads. The actual cost of fragmentation becomes more than technical, negatively affecting your team’s productivity and resulting in disjointed user journeys and a poor overall customer experience with limited ability to personalise and capitalise on AI.  

The impact on both B2B and B2C businesses is profound, with 20-30% of annual revenue lost due to inefficiencies caused by siloed systems and over 25% of customers defecting after just one bad experience. 

When digital expansion happens without a clear long-term governance strategy, a plethora of disconnected sites and technologies that are both difficult and expensive to maintain arise alongside fragmented user journeys and an inconsistent user experience. 

In most organisations, the website estate sits at the centre of the customer journey. When it becomes fragmented, the knock-on effects show up across the wider ecosystem, from how content is managed and how performance is measured to how CRM and customer data are used to enable personalisation. 

So, what are the warning signs that organisations should be on the lookout for when it comes to website sprawl and how might consolidation be the solution to this?

Fragmentation warning signs 

If these signs sound familiar, website sprawl may be taking effect:  

Inconsistent brand experience 

Users expect a seamless journey regardless of where and when they engage with your organisation. When different sites across your estate have different look-and-feels, inconsistent messaging or tone and navigation discrepancies, a lack of trust may arise and lead to reduced engagement.  

Duplicated content and publishing effort 

With every increase in the number of your websites, there is an increased likelihood of content duplication and discrepancies. This ultimately becomes harder to manage and makes the job of updating content across your sites a time-consuming minefield. Without strong governance or systems in place to manage this amount of content debt, conflicting and inaccurate information will continue to snowball and leave both your internal teams and users frustrated. 

Greater risk of security and compliance breaches

The more fragmented the estate, the more security vulnerabilities and increased likelihood of a malicious cyber-attack that devastates your business. This is especially true when it comes to older or forgotten websites that may not be fully patched. Similarly, as regulations tighten on key experience requirements like accessibility and data protection, the risk multiplies. Unless you have the operational bandwidth to monitor and maintain all your websites, you are opening yourself up for sanctions and fines. 

Rising maintenance costs

Each website introduces its own infrastructure requirements, costs and challenges. Managing the maintenance, hosting and support of multiple platforms is time consuming and leads to duplicated efforts.  

Hard-to-govern CMS landscape

If websites are built on different technology platforms, the operational burden grows substantially. Overhead increases when it comes to maintaining and building those sites. Integrations become more difficult and content and design changes require your team to learn multiple tools, workflows and processes.  

Poor data visibility 

Not only does a fragmented estate complicate gaining a unified customer view, but it obfuscates your websites’ analytics performance. Potential earnings are at stake because of the inability to provide users with personalised experiences and your team the ability to identify trends or insights to optimise experiences. 

These signs often indicate that your organisation needs a refreshed ecosystem orchestration and governance strategy to ensure that you can continue to scale and meet the ever-demanding needs of your users. 

The hidden costs for your organisation

The hidden costs of a website sprawl creep up in various places within an organisation. The operational drag of publishing and maintenance overhead can be felt by teams, while users grapple with inconsistent journeys that impact conversion and trust. Governance risks from compliance failures to accessibility issues and security exposure can arise and data fragmentation across platforms leads to measurement inconsistency.  

This cumulatively blocks personalisation, as relevant experiences cannot be scaled without a consistent foundation. 

What “good” consolidation looks like

Consolidation is about more than just reducing the number of websites in your ecosystem. It is about creating a coherent, manageable and scalable environment for your business to thrive digitally. When executed correctly, consolidation will unite each part of a digital estate under one governance model, ensuring consistency with content and design management. Its reusable components and shared design system, supported by a clear website and brand architecture, amplify this union.  

A composable headless CMS is central to this. It can create a single source of truth and eliminate one of the biggest causes of website sprawl: duplicate content across multiple systems. By centralising content and enabling its reuse across multiple websites, organisations can reduce reliance on fragmented legacy platforms. Separating content from presentation allows organisations to manage multiple sites from a single platform while delivering consistent user experiences across channels. This modular approach also enables legacy systems to be migrated gradually, which improves governance and reduces duplication.  

A shared measurement framework with analytics and tagging offers team comparable data and a single source of truth to work from. With accessibility built in by default, digital experiences can be enhanced and scaled confidently.  

Why consolidation is the entry point to orchestration

Website consolidation is often where fragmentation becomes most visible, but it is rarely just a website problem. True value comes when consolidation is approached as part of a wider ecosystem direction.  

Consolidation matters beyond websites because it: 

  • Reduces digital sprawl and the “surface area of complexity” 
  • Improves operational efficiency across teams and workflows 
  • Streamlines the connection between journeys, data, CRM and personalisation 
  • Creates a stronger foundation for consistent experiences, connected data and future orchestration 
  • Sets up a scalable foundation for the future of orchestration and AI-driven experiences

How CACI can help with your website & CMS consolidation

CACI’s approach to website sprawl and consolidation is grounded in practical experience, helping organisations regain control and build a foundation for sustainable innovation.  

We start by understanding your current environment, mapping out where sprawl and hidden costs are lurking. We then work with you to design governance frameworks, implement visibility tools and optimise your workloads. You gain ongoing support, regular reviews and continuous optimisation to retain your focus on what matters most: delivering meaningful experiences and fostering innovation. 

Speak to our specialists today to assess where sprawl is creating the greatest operational drag and where consolidation can help you unlock the most value. 

Download our ecosystem orchestration infographic to find out whether your platform still supports how you need to operate today. 

Next in our series, we will explore another common blocker to orchestration: how disconnected CRM and digital platforms limit personalisation, create inconsistency and what organisations can do to overcome them.

Why service design must begin with discovery

In this Article

In our first blog of this service design series, we assessed the impact of service design on end-to-end performance and why it is critical for leaders to understand its intricacies. This blog looks at the key role that discovery plays in service design.
 
Many organisations have already invested in service design: running a discovery, mapping journeys and building personas, uncovering pain points and presenting the findings. Yet despite the effort, very little remains unchanged in the day‑to‑day reality of how a service works. If that sounds uncomfortably familiar, you are not alone. Many leaders find themselves in the same position: plenty of insight, but not enough impact.
 
While service discovery is invaluable, it does not fix broken services, reduce operational costs or improve customer experience on its own. Insight is only powerful when it leads to action. This is the moment where most organisations stall and where the real work of service design begins.

What discovery will help your organisation achieve

Discovery surfaces the truth about how your service performs today, exposing friction, inconsistencies and unnecessary complexity. It reveals gaps between what users expect and what your organisation delivers through tried‑and‑tested methods:

  • Identifying pain points and experience failures.
  • Journey mapping to highlight where user effort is wasted or where support breaks down.
  • Service blueprinting to show the operational, policy and system-level issues creating that friction.

While these methods create clarity, clarity alone does not deliver change. It must be translated into decisions, prioritisation and delivery execution. Insight becomes valuable only when it moves beyond documentation and into operational improvement.

The most common point of failure in service design and transformation is not generating insight, but implementing it. This implementation gap is well recognised across large‑scale public service and organisational change, where strong discovery, policy or design intent often fails to embed into day‑to‑day delivery.

Why organisations struggle to move forward

  • No clear ownership of delivery, leaving recommendations without accountable leaders to drive them
  • Insights disconnected from a funded roadmap, so promising ideas never become prioritised work
  • Lack of governance or performance mechanisms to sustain improvements once they move into live operations
  • Misaligned teams (digital, ops, policy, technology) working on different goals, timelines and incentives
  • Operational complexity and legacy constraints that make changes difficult to implement at scale
  • Technology limitations that block even simple service improvements.

None of this is a failure of service design, but a failure of translation, from insight into action, from concept into delivery, and from isolated improvements into sustained, measurable performance gains.

What successful service transformation looks like

The organisations that unlock real value from service design treat discovery as the start, not the end. To convert insight into measurable operational improvement, they establish:

  • Clear prioritisation
  • A defined delivery roadmap
  • Alignment between digital, operational and customer teams
  • Governance and ownership
  • Measurement frameworks

How CACI helps turn discovery insights into operational changes

When it comes to service design, many organisations see the fastest wins by starting small. CACI’s quick‑start service design sprints are intentionally lightweight, low‑risk and designed to show value within weeks, not months. These are focused, time‑boxed engagements that target a single service, customer journey or operational hotspot, giving you immediate clarity on where improvements will deliver the highest return.

Because each sprint blends user insight, operational analysis and pragmatic delivery planning, you get tangible outputs fast: a prioritised set of improvements, clear owners and actions your team can implement straight away to maximise impact.

Whether you need a Rapid Service Assessment, a Blueprint Sprint or an AI‑Readiness Review, these agile engagements allow you to test the value of service design, prove ROI early and build momentum without heavy internal lift or long procurement cycles.

It is the fastest, safest way to turn insight into operational improvement with CACI supporting you every step of the way.

Discovery is essential, but value is only realised when insight leads to action and when service design is connected to delivery, governance and operational realities. For organisations that have already invested in discovery but now need to turn recommendations into measurable outcomes, this is the moment to bridge the gap.

CACI can help your organisation move from insight to implementation and from implementation to impact, translating discovery into decisions, decisions into action and action into service performance.

Contact CACI’s Service Design team to get started.

Top quick service restaurant trends for 2026: what’s shaping the future of QSR

In this Article

The quick service restaurant (QSR) sector is entering 2026 at a pivotal moment. Consumer demand remains resilient, but the operating environment is more complex than at any point in the last decade. Inflationary pressures, labour shortages, evolving customer expectations and rapid technological change are forcing QSR leaders to make sharper, more evidence-based decisions.

While much has been written about emerging QSR trends, many articles stop short of answering the most important question: which trends will genuinely deliver sustainable growth, and which risk becoming costly distractions? 

In 2026, success will depend less on adopting every new innovation and more on prioritising the right initiatives, in the right locations, for the right customers, underpinned by strong data foundations. 

Why QSRs can’t afford to ignore these trends

Globally, the QSR market continues to grow, but that growth is increasingly uneven. According to market analysis of the UK foodservice sector, total market value is forecast to exceed £85bn by 2026, with growth driven largely by QSR and delivery-led formats. 

However, this growth masks significant pressure beneath the surface:

Against this backdrop, trends are not abstract ideas — they directly influence network planning, pricing strategy, menu development and customer experience. Brands that understand how these trends play out locally are far better positioned to protect margins and unlock sustainable growth.

Top 7 quick service restaurant trends for 2026 

1. AI as a strategic engine, not just a technology layer 

Artificial intelligence has moved well beyond experimentation in QSR. In 2026, AI is increasingly embedded across forecasting, pricing, labour scheduling and customer engagement. 

Academic and industry research shows that machine-learning-based demand forecasting can reduce forecast error by up to 52%, directly lowering waste and improving operational efficiency. 

Additional industry analysis highlights that AI-enabled forecasting can reduce food waste by up to 25%, improving both sustainability and margins. 

However, the biggest gains come when AI is treated as a strategic capability, not a bolt-on. Without high-quality customer data, location insight and behavioural context, AI risks reinforcing inefficiencies rather than resolving them.

What leading QSRs are doing differently: 

Rather than deploying AI in isolation, leading QSRs are focusing on strengthening the data foundations that sit behind it. This includes improving customer data quality, linking transactional and behavioural signals, and incorporating location-based context into forecasting models. As a result, AI is increasingly used to anticipate demand, optimise decision-making and reduce operational risk, rather than simply automate existing processes.

2. Drive-thru reinvention: speed, accuracy and experience 

Despite the growth of delivery and mobile ordering, the drive-thru remains the backbone of the QSR model. Industry analysis consistently shows that drive-thru accounts for nearly 75% of QSR sales in mature markets.

Key developments shaping 2026 include:

  • Voice AI reducing average order time by 20–30 seconds per vehicle 
  • Increased use of queue analytics to manage peak-time congestion

Crucially, hospitality research shows that order accuracy and perceived friendliness have a greater impact on repeat visits than speed alone, reinforcing the need for balanced optimisation. 

What leading QSRs are doing differently:

Top-performing QSRs are moving away from uniform drive-thru solutions and instead optimising performance at a local level. By analysing demand patterns by site, time of day and customer mix, they are better able to balance speed, accuracy and service quality. This approach helps direct investment towards the locations and peak periods where improvements deliver the greatest return.

3. Omnichannel ordering and digital transformation (with loyalty at the core)

By 2026, omnichannel is no longer a differentiator — it is an expectation. Customers move seamlessly between apps, kiosks, drive-thru and delivery platforms. 

Industry data highlights that:

The challenge lies in orchestration. Fragmented systems and disconnected data undermine both margin and experience. Leading QSRs are investing in a single customer view, unifying transaction, behavioural and location data to understand which channels genuinely drive incremental value.

What leading QSRs are doing differently: 

Rather than treating channels independently, leading QSRs are building a more integrated view of the customer journey. By connecting data across mobile, in-store, drive-thru and delivery platforms, they gain clearer visibility of true customer value and channel interaction. This enables more consistent experiences, better-targeted loyalty strategies and improved understanding of which channels drive incremental growth.

4. Value-driven strategies in a cost-conscious market

Value has re-emerged as one of the defining QSR trends of 2026. According to UK consumer research, more than half of consumers actively compare prices before choosing where to eat

Additional findings show that:

  • Bundled meals increase average order value by 8–12% 
  • Limited-time offers drive trial without permanently eroding price perception

The most effective value strategies are location-specific, using data to tailor pricing and promotions to local demographics, competition and demand patterns. 

What leading QSRs are doing differently

Instead of relying on national price promotions, leading brands are taking a more nuanced approach to value. By analysing local demographics, competitive intensity and purchasing behaviour, they are tailoring offers and bundles to specific markets. This allows them to respond to price sensitivity where it exists, while avoiding unnecessary margin erosion in locations where demand is more resilient.

5. Sustainability and packaging innovation

Sustainability is now a baseline expectation rather than a differentiator. Research indicates that over 75% of consumers expect QSR packaging to be recyclable or compostable. 

Industry data also shows:

  • Packaging redesigns can deliver 10–15% material cost savings 
  • Food waste contributes 8–10% of global greenhouse gas emissions, increasing pressure on operators to reduce waste 

What leading QSRs are doing differently: 

Leading QSRs are embedding sustainability into operational decision-making rather than treating it as a standalone initiative. By monitoring waste, packaging usage and customer response at a granular level, they are able to test changes, measure outcomes and scale successful approaches. This data-led approach helps balance environmental goals with operational efficiency and cost control.

6. Health, wellness and radical transparency

Health-led eating continues to influence QSR menus. Consumer studies show that over 40% of UK consumers actively seek healthier options when eating out.

Protein-forward and plant-based items continue to outperform category averages, while demand for clear nutritional and allergen information grows. 

What leading QSRs are doing differently: 

Rather than expanding menus uniformly, leading operators are using customer insight to understand how demand for healthier options varies by location and occasion. This allows them to introduce targeted menu changes, refine portion sizes and improve transparency without adding unnecessary complexity. The result is a more relevant offer that reflects local preferences while maintaining operational simplicity.

7. Ghost kitchens and virtual brands: a more disciplined model

Ghost kitchens remain relevant, but success depends on precision. Market analysis shows that location selection and demand modelling are the biggest determinants of virtual brand success. 

Virtual brands are increasingly used to:

  • Extend trade area coverage 
  • Test new concepts with lower capital risk 
  • Optimise delivery economics

What leading QSRs are doing differently:

Successful operators are taking a more analytical approach to virtual brands and ghost kitchens. By combining demand forecasting, delivery radius analysis and competitive mapping, they are identifying opportunities that complement existing estates rather than cannibalise them. This disciplined use of data reduces risk and improves the likelihood of sustainable performance.

How QSR leaders can act on 2026 trends today

Understanding trends is only half the challenge. The real differentiator is execution. 

To translate 2026 trends into commercial advantage, QSR leaders should focus on five practical steps: 

1. Prioritise trends by impact, not hype 

Not every trend will matter equally to every brand. Use data to assess which initiatives will:

  • Drive incremental demand 
  • Improve operational efficiency 
  • Strengthen customer loyalty 

2. Ground innovation in customer insight 

Customer expectations vary significantly by location, demographic and occasion. Advanced segmentation and behavioural analysis help ensure investment aligns with real demand. 

3. Use location intelligence to guide decisions 

From drive-thru optimisation to ghost kitchens, place matters. Understanding trade areas, cannibalisation risk and local competition reduces costly mistakes. 

4. Test, learn and scale 

Pilot new formats, offers and technologies in controlled environments. Measure results rigorously before national rollout. 

5. Build a strong data foundation 

Unified, high-quality data underpins every successful trend — from AI to personalisation to sustainability.

Future outlook: what comes next?

Looking beyond 2026, the QSR sector will continue to converge with retail and digital commerce. Automation will increase, but human service will remain critical. Data will become more central — not just for optimisation, but for resilience. 

The brands that outperform will be those that:

  • Invest in insight, not just infrastructure 
  • Optimise locally, not just nationally 
  • Align innovation with measurable commercial outcomes

In a volatile environment, clarity beats complexity — and data-led decision-making is the most reliable route to sustainable growth. 

Frequently asked questions about QSR trends for 2026

What are the top quick service restaurant trends for 2026? 

The top quick service restaurant trends for 2026 include AI-driven operations, drive-thru optimisation, omnichannel ordering, value-led pricing strategies, sustainability-focused packaging and data-driven personalisation. These trends reflect rising cost pressures, digital adoption and changing consumer expectations across the QSR sector. 

How is AI being used in quick service restaurants? 

AI is used in quick service restaurants to improve demand forecasting, labour scheduling, order accuracy and personalised marketing. By 2026, many QSRs use AI to reduce food waste, optimise staffing and deliver more relevant customer offers in real time. 

Why is value such an important trend for QSRs in 2026? 

Value is a key QSR trend in 2026 because consumers are more price-conscious due to ongoing cost-of-living pressures. Quick service restaurants are responding with targeted value meals, bundles and promotions that balance affordability with profitability. 

Are ghost kitchens still relevant in 2026? 

Yes, ghost kitchens are still relevant in 2026, but they are used more selectively. QSR brands now rely on demand modelling, delivery radius analysis and location intelligence to ensure ghost kitchens are commercially viable. 

What role does data play in QSR trends for 2026? 

Data plays a central role in QSR trends for 2026 by enabling better decision-making across pricing, site selection, customer engagement and operations. Brands that integrate customer, transaction and location data are better positioned to adapt to market changes. 

How can quick service restaurants prepare for the future beyond 2026? 

Quick service restaurants can prepare for the future by investing in strong data foundations, customer insight and flexible operating models. This allows QSRs to test new concepts, optimise locations and respond quickly to evolving consumer behaviour.


What transaction trends & growth opportunities is the Food to Go sector experiencing in 2026?

In this Article

This year’s MCA Food to Go conference unveiled the key growth drivers, future trends and exciting developments shaping the sector. It highlighted everything from innovative technology and formats to trendsetting menus and marketing, ultimately exploring how successful brands are navigating market challenges.

At the conference, I showcased transaction trends and growth opportunities emerging in 2026 based on three months of data from CACI’s Brand Dimensions dataset. By tracking 30+ food to go brands from November 2025 to January 2026, I assessed the trends and opportunities fuelling growth questions this year. 

Here is what the data revealed. 

Food to Go transaction trends & growth opportunities in 2026

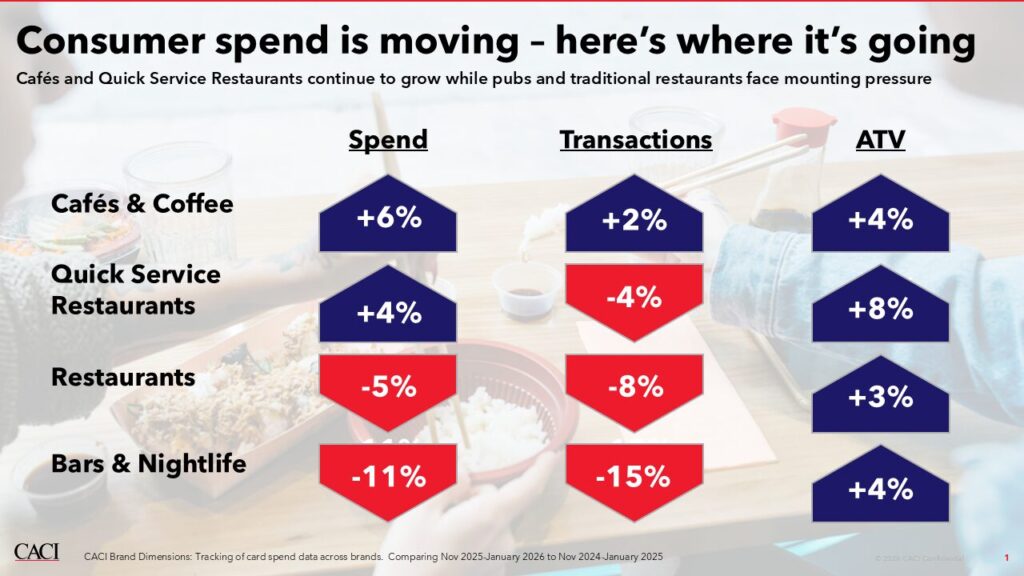
Graph showing change in consumer spend across different food industries. 'Cafes and Coffee' and 'Quick Service Restaurants' have seen the highest growth in spend

The findings showed: 

  • +6% YoY revenue growth in the Cafés & Coffee Shop market 
  • A slight decrease in Quick Service Restaurant (QSR) transactions, but a slight increase in Average Transaction Value (ATV)  
  • Transactions and revenue dropping across the wider F&B sector

Which brands are leading industry trends in 2026?

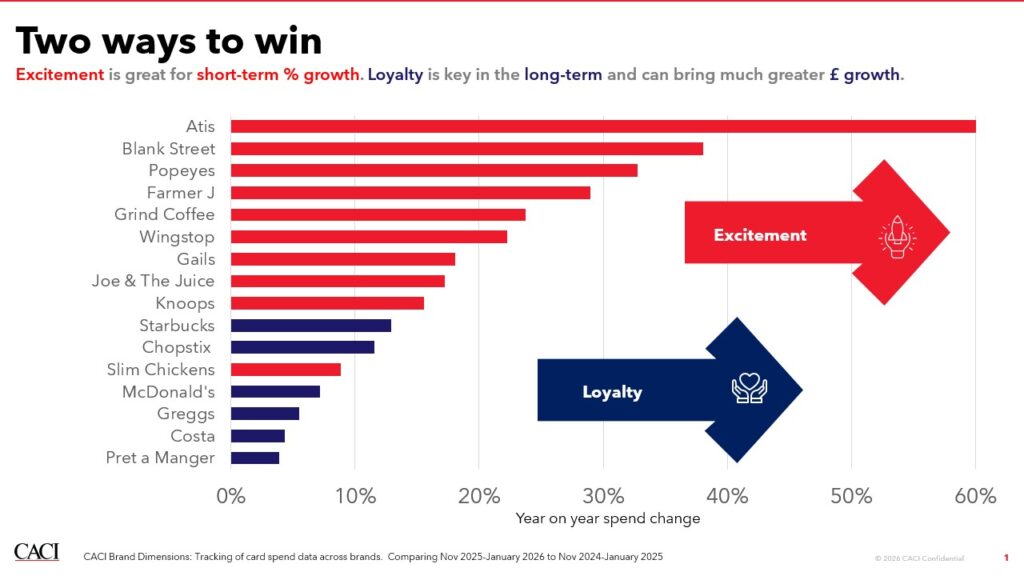
From the 30+ up-and-coming and major players in the food to go sector tracked, I identified the leading brands as those achieving YoY growth above inflation and sorted them by increase in growth percentage. 

Premium healthy lunches: Atis & Farmer J

Consumers continue to prioritise premium healthy lunches this year.  

The leading brands were Atis, growing 140%, and Farmer J, growing ~30%. Atis’ skyrocketing growth is driven by the opening of a third new space in the last year. While substantial and impressive, it is the smallest brand in CACI’s Food to Go tracker, meaning the overall GBP shift in the market is small.  

The largest share of the customer mix for these brands comes from CACI’s Acorn profiles Prosperous Professionals at 15% of spend followed by Up-and-coming Urbanites at 11%. 

For new entrants, the challenge to growth is proving value in each transaction, precise targeting and mission expansion without undermining the brand or cannibalising sales. 

Continued growth in chicken QSR: Popeyes, Wingstop & Slims

Consumers continue to seek indulgence and novelty. In the chicken QSR sector, our findings concluded Popeyes grew ~30%, Wingstop ~20% and Slims ~9% (who were +46% in the first quarter of the year). While this may counter the premium healthy lunch trend, consumers are finding ways to balance health-conscious choices with indulgent ones. 

Caffeine & matcha on the rise: Blank Street & Grind

Both Blank Street and Grind grew over 20%, indicative of the brands’ innovative products, strong social media presence and matcha-led menus. These brands have evidently appealed to younger, experience-driven consumers by creating excitement through their product innovation. 

Established brands are driving growth by harnessing loyalty 

Graph showing year on year spend change for a number of different food brands. The brands with the largest year on year spend change are Atis and Blank Street. The chart shows that while excitement is great for short term percentage growth, loyalty is key for long-term and spend growth,

The biggest takeaway is that while new entrants win on excitement, established brands win on loyalty.  

New brands have brought excitement, and with that, percentage growth, but most saw YoY growth rates slow across the year. Meanwhile, more established brands like Pret a Manger, Costa, Starbucks and McDonald’s saw stronger growth in the latest quarter. When assessing actual pounds versus percentage growth, established brands are back growing and seeing very substantial sales gains. This reiterates the impact of loyalty on long-term growth.  

The formula of the current state of the market then becomes:  

Excitement = short-term percentage growth. Loyalty = long-term monetary growth. 
 
New brands, social media influence and new cuisine are fuelling excitement. Loyalty is driven by familiarity, perceived value, brand resonance and communication. Brands that can achieve a sweet spot between both are poised for sustainable growth. However, our findings suggest tension between excitement and loyalty. This prompts brands to reflect on how to maintain excitement or build customer loyalty.  

Four strategies to drive growth in a tough climate

1) Having the right products in place 

Brands must understand how to appeal to existing customers and excite new ones. Product and menu innovation should be strategically considered to open new missions and tailor to the right locations, dayparts and missions.

2) Getting the right space

While growth can be achieved by acquiring new spaces, established brands are always optimising their spaces to reach the right people, in the right place, at the right time. This is why some brands are shifting to drive-through locations as town centres decline and why many have opted to offer FMCG products in the chilled sections of supermarkets.

3) Appealing to customers through the right message 

Tailored content sent to the right target group at the right time with the right incentive is critical to success. 

4) Delivering with the right service

Profitably staffing each location, determining which locations will best suit trialling self-service kiosks and avoiding alienating or upsetting customers who value your brand’s personal service are critical considerations.

This is often easier in the new entry “excitement” phase, but new and established entrants must constantly evaluate that they have the right mix of these factors to remain relevant in a rapidly changing market. Each of these strategies has a ‘people, place and time’ lever that can be pulled to maximise growth by leveraging customer loyalty.  

How CACI’s Brand Dimensions can help your Food to Go business thrive

With so much complexity in the food to go sector, brands need more than just internal customer data to keep on top of the mix. Supplementary market data through CACI’s Brand Dimensions can help you answer your growth questions, combining the right data with the right tools to project long-term growth through the right mix of products, services, places and messaging. 

Highly detailed, timestamped transaction data is at the heart of Brand Dimensions, indicating anonymised customers and specific outlets to infill any data gaps and gain unique performance and competitor outlet insights.

When combined with anonymised mobile activity data and demographic classifications, it creates a cohesive base to address the people, place and time levers driving growth. This can also be topped off with lifestyle attributes linked to those demographics, competitor location data and competitor sentiment data. 

Through this, businesses can better prepare for the future by understanding consumer behaviour at brand level. 

Although Brand Dimensions is typically tracked on a monthly basis, these findings have been summarised quarterly for this blog.  

If your brand could benefit from these data insights, book a Brand Dimensions demo with us. 

Ecosystem orchestration: Why fragmented platforms hold your organisation back

In this Article

“Our digital transformation is failing because it is fragmenting”. This was the defining statement from a recent roundtable with C-suite leaders from global enterprise organisations, met with nods and echoes of agreement across the room.  

Many of these leaders went through mergers and acquisitions, regional expansion and business proposition changes. The end result was the same: hundreds of disconnected tools and platforms, masses of digital sprawl, rising inefficiencies, disjointed customer experiences and a tangled web of overlapping technologies.  

If this sounds familiar, you are not alone. Over 40% of organisations now operate four or more separate systems, and while multiple platforms can signal maturity, the lack of integration between them often introduces operational friction—slowing delivery, increasing costs, limiting personalisation and constraining AI adoption.  

This is where ecosystem orchestration becomes strategically imperative in designing how your entire digital ecosystem works together. 

What is ecosystem orchestration?

Ecosystem orchestration is the discipline of designing, connecting and governing all digital platforms, experiences and data as a unified system rather than a disparate collection of isolated tools and journeys. It defines how these technologies should work together to deliver efficient operations, connected customer experiences and AI-ready foundations. 

For most organisations, this ecosystem spans experiences, content, data and their supporting platforms. 

Ecosystem orchestration focuses on: 

  • How data flows across your CRM, CDP, CMS, analytics and personalisation 
  • How experiences are assembled across channels, regions and brands to make them seamless 
  • How your platforms integrate, scale and evolve alongside your organisation  
  • How governance, security and performance are embedded by design. 

What is digital fragmentation? 

Fragmentation rarely appears as a single problem. Instead, it develops gradually as new platforms, regions and business needs are layered on existing digital estates. If one layer is weakened, it reduces the effectiveness of the entire structure and ultimately damages both your business outcomes and perceived value to your customers. This inefficiency prevents your organisation from reaching its potential.

Fragmentation tax: The unwanted cost of disconnected systems

When digital ecosystems grow without orchestration, the impact compounds over time. You may start to see: 

Operational inefficiencies rise 

When your teams jump between multiple systems, duplication and manual work skyrocket. Delivery slows and administrative load increases. 

Maintenance outweighing innovation 

Technology teams spend more time maintaining integrations, bug fixing and patching software than building new value-generating features. 

Data reporting inconsistencies

Inaccurate data creates reporting inconsistencies and data teams spend more time reconciling data than generating insights.  

Personalisation becoming impossible

Disconnected CMS, CRM and data platforms mean your organisation does not have a single customer view. This leads to segmentation being non-existent or superficial. 

AI-readiness severely constrained

AI requires unified data, modern architecture and consistent governance. Poor data hygiene and siloed insights create unstable foundations for predictive modelling and limit automation at scale. 

Brand and experience consistency breaking down

Multiple regions and brands lead to inconsistent UX, duplicated content and disconnected customer journeys. 

Costs quietly increasing

Duplicated platforms, unnecessary licences, security vulnerabilities and inefficient workflows inflate spend. 

Leadership is struggling to make data-driven decisions

Fragmented data erodes trust, making it harder for leaders to drive strategy or prove ROI. 

What ecosystem orchestration will enable

Fragmented digital estates can derail even the most ambitious digital transformation plans. Ecosystem orchestration is the solution to ensuring your business is future-ready, laying the foundation for scalable experiences, operational efficiency and AI-ready growth. 

If the challenges described here feel familiar—from disconnected journeys to rising operational effort—it may be time to reassess how your ecosystem is designed to work together.  Speak to our team about simplifying your digital ecosystem. 

CACI announced as AWS Launch Partner for European Sovereign Cloud (ESC) delivering EU-controlled data and compliance

In this Article

CACI Ltd is delighted to announce it has been selected by Amazon Web Services (AWS) as an official launch partner for the AWS European Sovereign Cloud (ESC), a major AWS initiative designed to help organisations meet stringent European digital sovereignty, security, and compliance requirements.

This appointment further reinforces CACI – a global AWS Premier Tier Partner – as a trusted advisor for organisations looking to adopt sovereign cloud solutions while leveraging the scale, resilience and innovation of AWS.

The European Sovereign Cloud is purpose-built to ensure the highest levels of governance and assurance, making it particularly suited for mission-critical and highly regulated sectors such as public services, national security, defence, financial services, healthcare, and critical infrastructure. This is also essential in supporting large commercial organisations navigate regulatory landscapes, protect sensitive data, and maintain customer trust at scale.

Why are the AWS ESC Principles Important?

The AWS ESC applies the principles above in the European context, giving organisations absolute confidence that their data and operations remain under tight European control, while enabling innovation without compromise.

Key capabilities include:

  • EU-only operations: managed exclusively by EU-based personnel, ensuring governance and operational independence.
  • EU data residency: all customer data – including metadata – remains within the EU, supported by isolated service environments.
  • Independent European infrastructure: physically EU-based facilities with separate control systems including independent billing, security, and multiple Availability Zones for resilience.

What Being an AWS ESC Launch Partner Means for CACI Clients

CACI brings proven expertise in cloud transformation, security, and compliance. Becoming an ESC launch partner further enables CACI to:

  • Guide organisations through sovereign cloud adoption using AWS best practices.
  • Deliver secure and compliant solutions tailored to EU regulatory requirements.
  • Enable innovation without compromise, by combining sovereignty with AWS scalability and resilience.

To prepare for this milestone, CACI has invested in advanced training for its teams on AWS Digital Sovereignty competency and principles, ensuring clients receive expert guidance in planning, migrating to, and operating sovereign cloud environments.

Tracy Weir, Chief Executive of CACI Ltd, comments: “We’re proud to be named an AWS launch partner for the European Sovereign Cloud. This partnership reinforces our dedication to helping organisations across public and private sectors meet stringent sovereignty requirements, whilst leveraging the power of AWS. It also underlines our commitment to delivering excellence and best practice across every stage of AWS cloud adoption.”

CACI AWS Credentials and Sovereign Cloud Expertise

CACI pairs deep AWS expertise with secure cloud delivery experience across defence, public services, finance, healthcare, and critical infrastructure. Our powerful capabilities include:

  • First AWS Trusted Secure Enclave Vetted Partner the UK providing trusted National Security & Defence sensitive solutions
  • Other AWS Competencies including Migration, DevOps and Government Consulting
  • A partner ecosystem of 36+ strategic partners across all verticals
  • Jezero Landing Zone Accelerator: AWS validated secure cloud LZA enabling rapid deployment on AWS, and compliance with global security standards
  • 400+ AWS certifications: held by expert CACI engineers.

AWS ESC launch timeline, locations, and investment

AWS ESC begins its roll out from January 2026, starting with its first region in the State of Brandenburg, Germany, expanding capabilities and coverage to additional regions over time. This phased approach reflects AWS’s commitment to supporting European organisations with scalable, sovereign cloud solutions.

AWS has also committed €7.8 billion in investment in Germany by 2040 as part of this initiative, reinforcing its long-term support for European digital sovereignty and innovation.

With over five decades of delivering complex programmes across commercial and public sectors including highly regulated, mission-critical industries, CACI is well-positioned to help organisations adopt secure, compliant cloud solutions on the AWS European Sovereign Cloud.

For help with ESC or any AWS or other cloud projects, get in touch today.

Is your attitudinal segmentation delivering the value you need?

In this Article

As attitudinal segmentations are usually based on surveying a smaller sub-group and not based on data which can be easily applied to customers on your database, bridging attitudinal segmentations can be a challenge and is not always a straightforward process. However, it is a great way to provide a consistent customer experience.

So, what is attitudinal segmentation and what considerations should an organisation have when it comes to their approach for bridging an attitudinal segmentation?

What is attitudinal segmentation & how to bridge an attitudinal segmentation

Attitudinal segmentations are typically created using data from quantitative surveys. They can be a powerful tool for delivering rich insights into customer and prospect mindsets and provide a valuable framework for organisations to engage customers effectively through an in-depth understanding of their needs, attitudes and motivations.

Being able to treat customers consistently throughout the marketing funnel helps to establish a relationship with them and deliver resonating messages that will drive increased engagement. Once someone becomes a customer, they will expect to see the same messages that originally struck a chord with them reflected and developed in their ongoing journey with you.

The economic and social disruption since the pandemic has permanently changed consumers and their expectations of brands, so ensuring your online messaging aligns with these changes is increasingly important. We consistently see organisations that are personalising messaging for their customers increasing their market share, net promoter scores, return on investment and profitability. With this in mind, being able to make your attitudinal segmentation actionable on your database should be a key part of your customer engagement strategy.

Key questions to address the challenges of bridging an attitudinal segmentation onto your customer base

There are no two ways about it – data is key to tackling this challenge and making it actionable. To achieve this, you should ask the following five questions to get started:

  • Where and who created the segments? Were the segments created by your organisation or a media/research partner? This is pertinent to understanding if you can get to the raw data or in understanding the level of granularity of data you can obtain.
  • What data is there? Do you have access to the responder level data or tables by segment or Pen Portraits? The data you can reach will determine the method of bridging that can be used.
  • Were questions only posed to your customer base or to the wider population? What types of questions were asked and were they personal to the organisation or more generalised? This can impact the resulting solution.
  • Are there any behavioural traits reported within the data that were part of the same survey? Wider data beyond pure attitudes can be helpful to model this back to the database.
  • Were any demographic questions asked or was postcode captured? This can help the process of creating the link between segments and customer base.

While bridging an attitudinal segmentation can be challenging, these questions will help identify how simple or complex the solution will be.

Key techniques for bridging attitudinal segmentation

Depending on the granularity of the data your organisation has access to, the following techniques can be leveraged:

  • Responder level data: As this is the most granular form of data, it produces the most accurate results. Techniques here include modelling each of the segments by using a mix of the responder data and CACI’s own data to score this up against a customer database before validating this against the responder panel.
  • Tables by segment: We can compare each customer’s results to the segment averages based on a combination of multiple data points. Validation is key through profiling and sense checking the segment distribution.
  • Pen Portraits: Here we would use a rules-based approach to recreate segments based on high-level views of the segment to capture the different blend of information that you have to bridge the data. As before, the final step of validation is key to ensuring the solution’s accuracy.

If raw data is inaccessible or unavailable, the following alternative methods can support:

  • Adding golden questions to market panels: This will provide more demographic and behaviour traits which support the bridging process.
  • Surveying the whole customer base with golden questions: Responses can often be skewed to particular segments, however, and some consumers may be more inclined to answer than others.

Considerations at the start of an attitudinal segmentation journey

Including key customer traits

When beginning an attitudinal segmentation, our first recommended consideration would be to include some key customer traits. Including additional questions such as demographic markers (postcode, gender and age band) will support segmentation mapping on to the database.

Cross-team engagement

Cross-team engagement will be invaluable to ensure the segmentation meets goals and drives value. This will help flesh out what the segmentation will be used for now and in the future, as well as gauging what you need from the segmentation and building it accordingly. It is also pertinent in getting buy in as early as possible to ensure teams are engaged when the solution is rolled out.

Backing segmentations with research

Another solution would be to build the segments first and then use research to enhance them with attitudinal values. This solution can work well with one of the benefits of running focus groups to bring life to the segments rather than using the attitudes to drive the segmentation.

Ultimately, it is about finding the right balance that works for your organisation based on wants and needs. Attitudinal segmentations can bring excellent insights but are limited in their applications across a database. Fundamentally, it is a process of ensuring that through engaging the whole organisation, your solution is optimised to meet strategic aims.

How CACI can help

CACI is in a unique position with a UK-wide dataset on all adults, encompassing over 800 variables that we can use to profile and create proxy variables to support the possibility of a successful bridging exercise. We help solve the challenges associated with bridging attitudinal segmentation for leading organisations many times each year.

To learn more about getting the most out of your segmentation and how CACI can support you through this journey, get in touch and we can discuss your challenges in more detail.

What is Marketing Mix Modelling (MMM)?

In this Article

Benefits of marketing mix modelling (MMM)

For any marketing activities to be successful, understanding consumers’ behaviours and whether a channel is oversaturated is essential. While data and analysis play undeniably important roles in this, marketing mix modelling (MMM) plays an even greater one, representing the merging point of data and analysis with the psychology of consumer understanding.  

Marketing mix modelling (MMM) is a statistical tool that enables an understanding of how each part of an organisation’s marketing activity impacts consumers’ behaviours, sales, return on investment (ROI) and more. Through MMM, an organisation’s performance can be broken down by channel and various types of data can be incorporated to evaluate the effectiveness of marketing activities and determine which are making the most substantial differences to the organisation’s overall performance. 

  • Enables organisations to quantify and measure marketing channels effectively to assess which drive the most sales and return on investment 
  • Equips organisations with long-term insights that will bolster planning through effective forecasting and marketing campaign generation based on previous performance  
  • Helps organisations allocate budgets according to the best performing channels due to measuring growth based on investments
  • Instils confidence due to its statistical reliability and being privacy-safe, both of which are particularly important in a post-cookie world
  • Offers organisations a holistic view of the impacts that various factors will have on achieving specific KPIs, ensuring marketers can make more informed decisions based on how and when marketing activities will impact KPIs. 

How do marketing mix modelling (MMM) & commercial mix modelling (CMM) work?

Marketing mix modelling (MMM)

Marketing mix modelling (MMM) is used by organisations aiming to understand how marketing activities impact KPIs being measured. Its ability to measure the impact that certain pricing choices, promotional offers, product launches or advertising campaigns may have on sales makes it a game-changer for organisations. 

In MMM, the dependent variable used to assess the relationship between sales and marketing activities is usually:  

  • Sales volume: to assess the impact of different marketing activities on sales 
  • Revenue: to track the amount of money generated by sales 
  • Competitor analysis: to understand how your organisation’s marketing activities are affecting your position in the market. 

In contrast, the independent variables in MMM are the marketing activities or factors that might drive those results, such as: 

  • Advertising spend: the amount invested in promotion across various channels. 
  • Price: to explore the impact of price adjustments on sales 
  • Promotions: discounts, coupons, or offers that could increase sales 
  • Distribution: the potential impact of product availability across various locations on sales. 

Commercial mix modelling (CMM)

Commercial mix modelling (CMM) is an analytical approach that examines a variety of commercial factors that drive an organisation’s performance. It begins with collecting data from across the organisation on pricing, promotions, distribution channels, products and more, combining the resulting data into a cohesive dataset.

The insights presented within the dataset help organisations gauge which factors contribute most to performance and where investments result in the highest returns. It also enables organisations to test various scenarios— price changes, promotional adjustments, changes within distribution channels— to assess the potential impact on performance. Through this, organisations can optimise their overall commercial mix to grow and become more profitable.  

How does commercial mix modelling (CMM) differ from marketing mix modelling (MMM)?

While both commercial mix modelling (CMM) and marketing mix modelling (MMM) are granular approaches that help organisations analyse the impact of marketing activities, their scope, methodology and applications differ.  

Scope

CMM offers a broader approach when it comes to evaluating the marketing activities that would impact an organisation’s performance, integrating various functions to optimise revenue and profitability. It encompasses external, non-marketing data sources such as weather, seasonality, competitor pricing, interest rates, etc.  

MMM, on the other hand, is more partial, purely marketing data that offers a more detailed and expansive result. As a statistical analysis method, it quantifies the impact that marketing activities— campaigns, paid advertisements, promotions, etc.— have on specific KPIs. Focusing more on media and investments rather than a wider marketing strategy, its granularity is what marks its stark contrast to CMM.  

Despite the broad scope of CMM, it is just as granular and technical as MMM. 

Methodology

CMM blends analytics, business intelligence and strategic insights, considering both internal and external factors that can affect an organisation’s growth. The approach entails: 

  • Scoping & data auditing:
    • Understanding the KPIs and defining whether the model should target revenue, acquisitions, renewals or some combination form the scoping basis. Data auditing includes tech and journey mapping to determine the stages comprising the funnel for lead gen and closing, as well as the tools and tech used at each stage. 
  • Data collation & cleaning:
    • This includes a data request to outline the full scope of what can be used in the model, with cleansing, organising and playback taken into consideration to check for completeness and broad accuracy. During this stage, data is also combined and reaggregated for ingestion into the model. 
  • Exploratory analysis & feature configuration:
    • Plotting all the raw data to understand distribution and periodicity and exploring this raw data to identify gaps and anomalies is conducted during this stage. Correlation analysis helps find feature relationships and possible collinearity, feature types are configured for use in the model and decay is applied (AdStock) to channel features to simulate the memory effect of advertising.
    • Diminishing returns to channel features simulate channel saturation and other transformations such as smoothing or feature combination.  
  • Pre-processing & feature engineering:
    • Calendar and dummy variables can be included to represent milestones and seasonality, with each variable transforming across a range of parameters to find the most realistic behaviour. 

  • Commercial mix modelling (an iterative process with pre-processing & feature engineering):
    • Once the model for the approach is scoped (e.g. logistic vs. linear, pooled, nested, hierarchical) and fit for processed features to optimise accuracy and generalising power, it is then checked against existing commercial knowledge and external priors and returned to feature processing to refine variables and tune parameters accordingly.
    • All candidate variables are imported and tested from the pre-processing stage. Finally, the model is refined continually by adjusting variables to optimise statistical measures of accuracy. 
  • Optimisation & simulations:
    • The present channel saturation is analysed, the optimal channel mix is delegated for specific budgets and results are presented from scenario simulations to understand which channels have headroom and which are oversaturated.
    • A budget guide is provided for optimising revenue and the ability to plan for different scenarios: mitigating headwinds, capitalising on opportunity and planning contingencies. 
  • Next steps & recommendations:
    • Recommendations are given based on budget optimisations and added value. 

MMM, in comparison, focuses on econometric modelling and regression analysis to determine the contributions made by various marketing channels on an organisation’s outcomes. Econometric modelling is a statistical, mathematical approach that quantifies the relationship between marketing activities and business outcomes, built with historical data. Regression analysis is a technique used within econometric modelling to measure the impact of independent variables (marketing activities) on dependent variables (sales or revenue). 

Application

Senior executives and C-suite employees may use CMM for longer-term strategic planning and decision-making, whereas MMM would be used by marketing teams to optimise spending and budget allocation towards campaigns or advertisements.  

The broader scope of CMM enables senior executives and C-suite employees to gain a complete picture of the various commercial drivers and their impact on marketing rather than isolated results. On the other hand, the granularity of MMM ensures marketing teams strategically plan and forecast how changes in spending across channels might impact sales and plan scenarios accordingly. 

How to build a marketing mix model

The first step in building a marketing mix model will be to collate and prepare your data. This will involve collecting historical data on sales and marketing spend across different channels and should go back far enough in time to effectively capture market conditions and seasonality fluctuations. 

Next, selecting the appropriate model to facilitate this will be crucial. Selecting the model can come from its robustness or flexibility, catering to your organisation’s unique needs. 

Building the model will come after this. This will include defining the relationship between marketing spend and sales or other KPIs and considering carryover effects, saturation or external factors. 

Furthermore, fitting the model will use your historical data to estimate the parameters of the MMM. Once the model is fit, the results can be analysed to precisely determine their contributions towards each marketing channel. 

Finally, the insights gleaned from these results can help you adjust marketing strategies accordingly, increase budgets within the highest-performing channels and reduce it in those underperforming. 

Examples of marketing mix modelling (MMM)

Organisations across a variety of industries can apply marketing mix modelling (MMM) to lead to improved outcomes. A few of such examples include:  

  • Consumer Packaged Goods (CPG): Gathering data on sales, advertisements, campaigns and pricing can help CPG organisations understand which channels—digital advertising, TV campaigns, etc.— drive the most overall return on investment. 
  • Retailers: From seasonal promotions to discounts and the influence of both in-store and online presence, retailers can leverage MMM to understand peak performance periods, digital sales and foot traffic to allocate budgets accordingly or reassess promotional calendars.  
  • Financial Services: Financial institutions can use MMM to evaluate their multi-channel advertising efforts and ensure they are reaching the appropriate audiences, encouraging sign-ups.  

Why businesses should choose CACI to carry out CMM 

CACI supports businesses in their delivery of optimised marketing efficiency by: 

  • Determining the value and performance of activity through evolved multi-touch and econometric modelling 
  • Producing results to sustain and increase growth through targeted investment and improved marketing performance 
  • Delivering improved accuracy, consistency and availability of marketing performance insights 
  • Enhancing capability by evolving data, technology and process 
  • Supporting the provision of ongoing strategic and delivery resource 
  • Helping businesses dig into bespoke segments and utilise in-house data products to unlock insights 
  • Offer businesses location-based insights into the effects that marketing has at various levels, from stores to regions.  

Find out more about the impact that marketing mix modelling can have on your business by contacting us today

Click here to read our short infographic to learn how CACI’s Commercial Mix Modelling can transform your business strategy.

Sources:

Case study

How Allwyn uses CACI’s territory & route optimisation tools to successfully expand their field sales team & stores

Summary

Allwyn officially took over as operator of the UK National Lottery at the beginning of 2024. As part of this major acquisition, Allwyn has grown its sales team to deliver key initiatives as part of the new licence. To successfully do so required a two-fold objective:

1. Ensure a smooth running of visits for existing Retail Sales Executives covering over 40,000 stores on a quarterly basis.

2. Grow the size of the team to 155 Retail Sales Executives to increase the quantity and quality of visits.

CACI had established a long-standing relationship with the previous operator of the National Lottery and had a proven track record of delivering projects for them. Allwyn therefore knew it could turn to CACI as a trusted partner who would understand the work required to help meet their objectives.

Company size

6,000+

Industry

Leisure, Arts & Entertainment

Products used

Challenge

New territories and routes needed to be designed to quickly set the wheels in motion.

As an expanded field team, Allwyn had to ensure that these routes and territories were optimal to meet deadlines and mitigate any disruption from the previous operator’s handover.

Solution

Allwyn commissioned CACI to undertake a headcount analysis and territory optimisation project using CACI’s territory optimisation tool, InSite FieldForce. CACI went on to create optimal routing solutions for Allwyn, using their cloud-based route optimisation software, CallSmart Web, to ensure the following: 

  • A correctly sized team would be in place for their expanded network of over 40,000 stores 
  • Ideal locations to recruit new Retail Sales Executives would be known
  • Territories are optimised to balance work evenly, maximising each Retail Sales Executive’s potential
  • The number of scheduled visits would be maximised and driving time minimised.

With their team of experienced field marketing optimisation experts, CACI was able to bolster the above objectives for Allwyn. Allwyn has also licenced CallSmart Web, which enables them to self-serve and optimise routes once personnel are in place. Ongoing training and support for Allwyn is provided by CACI’s experts during this transitory period as they move towards more software usage.

Results

Following CACI’s headcount analysis and territory optimisation work, Allwyn’s Retail Sales Executives have been working with balanced workloads, ensuring they are neither overworked nor underutilised, with an average utilisation (including commute) of 86%. This helps the business understand whether there is sufficient time remaining for additional tasks such as prospecting, admin and more. 

The territory optimisation work has enabled Retail Sales Executives to spend 79% of their time with customers, and less time driving. This is in addition to achieving their target number of visits per day.  

The fair distribution of workload has also meant that CallSmart Web is able to produce the best possible schedules for all of Allwyn’s 155 Retail Sales Executives, leading to 100% of scheduled visits across a 10-week call cycle. 

The combination of using CACI’s expertise via consultancy and software solutions has allowed Allwyn to successfully go live with its expanded field sales team of 155 Retail Sales Executives while continuing to ensure a smooth running of all visits across their store universe of over 40,000 outlets. This highlights the importance of a tailored approach, as well as the countless benefits of optimised and efficient territories as well as visit schedules. CACI continues to be on hand to provide technical expertise and support to ensure a continued success for this partnership.