Posts Adapting to Change in Your Community: FRS community engagement & communication choices

Adapting to Change in Your Community: FRS community engagement & communication choices

In this Article

Different Strokes For Different Folks

There are so many media and channels you can use to get your vital messages across. Communicating and engaging effectively means picking the right ones for the people you need to reach.

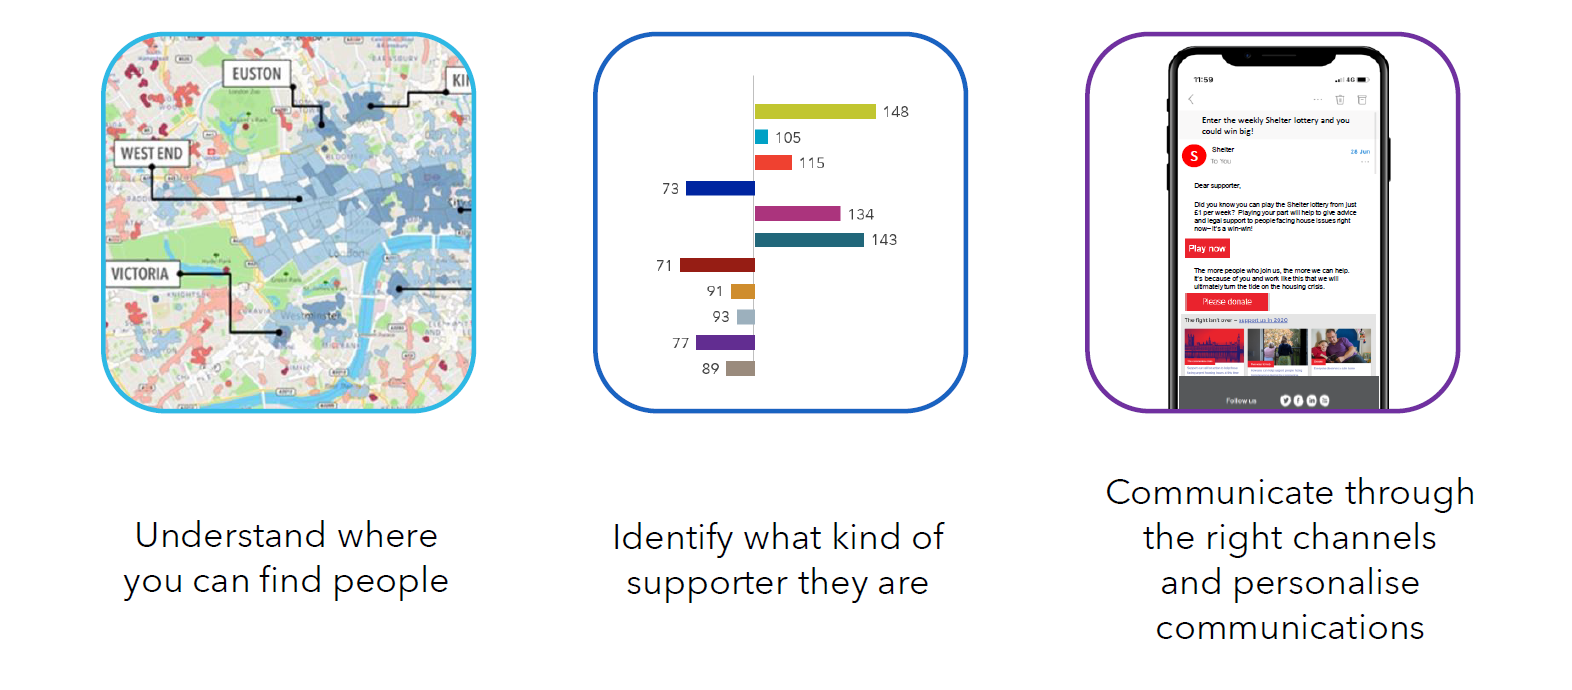
Identifying different capabilities, characteristics and preferences among your residents is important, if you want to be sure you’re reaching people with information they need. Using data from a range of sources, you can produce reports that help you understand the needs of different households and segments in your community, so you can confidently choose the best communication and outreach methods.

Of course, you have to work to a budget to produce and deliver content. Going online can help cut costs compared to printing, postage or face to face events. Online content can be easier to update and adapt to meet changing needs. And under the current constraints of the pandemic, when face to face engagement is difficult, it’s tempting to go all-digital.

But as every FRS colleague knows, not every resident is digitally connected. Some of the most vulnerable people in your community will not have access to social media, the internet or email, or their digital capabilities may be limited without support.

Modern FRS organisation use a wide range of communications channels and media: each has strengths and weaknesses for different audience types and may work better for certain types of messaging, campaigns and content:


Digital Media

Direct contact channels: email, text messaging, chat facilities (website chat, direct messaging on social media)

Broadcast channels: social media posts (Facebook, twitter, Instagram), online community groups (Facebook), webinars and community conferences (YouTube, Zoom or other broadcast platforms)

Digital content: Infographics, data visualisations, video, podcasts, vlogs, blogs


Traditional Media

Public channels: local papers (articles, paid ads, interviews), local radio (ads, phone-ins, interviews), community exhibitions, empty shop window displays, posters, presentations (community events, schools, community organisations)

Direct delivery (mail or door drop): regular or one-off newsletters, personally addressed letters, generic leaflets, generic letters, flyers, postcards

Telephone: outbound phone campaigns, phone helplines

The immediacy, ease of use and interactive nature of digital communication is a good fit for many people in your community who are used to using mobile phones, tablets or computers for everyday transactions and communication. The challenge is to identify those people who are excluded from those channels and make sure that you direct traditional alternatives to their individual households.

Blended data insight can help you to do this [hyperlink to blog or paper]. Working with CACI’s local government and FRS data specialists, you can accurately identify households and groups that don’t have access to digital channels. You can profile residents to reveal who is likely to respond well to particular types of communication that match their habits and preferences.

By targeting the right media and activities to the right people, you can ensure that safety and protection messages get through where they’re most needed. You’ll get better value from communication budgets with campaigns targeted by segment rather than using door drops or mailings for blanket coverage.

There’s more information about communications methods and segmenting community audiences on the Local Government Association’s Comms Hub.

Get in touch with CACI’s FRS data specialists for help and advice on community segmentation and channel selection.

Adapting to change in your community: The new FRS community landscape for 2021

In this Article

The Impact of the Pandemic

Discover how the impact of the pandemic and lockdown have changed the protection and prevention needs of individuals and households.

The Covid-19 era has brought far-reaching changes to citizens and communities all over the UK. Constraints on going out, changes to working patterns and the after-effects of illness and isolation have made a big difference to people’s behaviour and habits.

For FRS organisations, this is important. It means that proven engagement and communication channels may no longer be effective, so your vital messages don’t get to the people who need them. It means that people are spending more time in their homes and using them for different activities, potentially changing their risk profiles. It means that people may be physically and mentally more vulnerable to fire and emergency incidents.


We’ve Highlighted 5 FRS Actiities to Review in Context of 2021’s Still-Evolving Pandemic Situation


1. Home Safety Visits (Safe & Well)

Historically, these have played a pivotal role in reaching people who are most at risk of being victims of residential fires. With constraints on non-essential contact, your FRS may already have had to reduce this programme. But more people are spending time in their homes, so the importance of providing advice and checking smoke alarms is greater than ever.

Recommendation: Assess alternative communication channels for providing Home Safety Advice – social media and online communications may be effective for some households. For those who digitally excluded, prioritise the most vulnerable and at risk households to visit in a Covid-safe manner.


2. Awareness-Raising Events

Speaker events in schools, workplaces, residential homes and at community events and clubs are excellent ways to engage with different sections of the community, from youngsters to business owners or people for whom English is not a first language. These presentations and sessions in familiar and trusted settings help get across messages about safety and behaviour to reduce fire risks. Group events and meetings are currently prohibited and unlikely to resume in full for some time.

Recommendation: These groups and organisations may well be using alternative channels and communications to stay in contact with their members. Offer them suitable content to include. For example, an online FRS assembly for your community secondary schools or a list of safety tips to insert in the newsletter delivered door to door by a faith community.


3. Community Displays

With libraries and community centres either closed or restricting access in lockdown and beyond, there’s no opportunity to mount FRS displays and campaign information that used to be seen by many. Using vacant shop units is less effective, with high street footfall greatly reduced.

Recommendation: Essential retailers such as local shops or supermarkets may have community noticeboards where you can share important messages or posters which will be seen as customers pass by. Local papers and TV channels may be prepared to publicise your campaigns, if you highlight the challenges and risks that lockdown has brought to FRS and the efforts you’re making to stay engaged to save lives.


4. Digital Campaigns and Communication

Digital channels are a lifeline in the pandemic. Many households have improved their connection and understanding of technology, using video platforms like Zoom or Teams for the first time, for work, education and social contact. Consumers who use social media and stream content are doing it more than ever, while confined to their homes. But digital channels are not accessible to everyone – it’s important not to rely on them completely.

Recommendation: Understanding digital engagement is key to effective communication with residents. In pandemic circumstances, you need to know how to engage vulnerable and at-risk groups who may not be digitally connected. They may need doorstep engagement or paper-based information. The challenge is to identify digitally excluded households and target them with appropriate FRS outreach, while making the most of more cost-effective digital methods for those who can access it easily.


5. At-Risk Household Profiling

Poor health and social isolation are factors which can increase the potential risk of fatality or injury when a fire occurs. Identifying residents with increased vulnerability helps to make risk scoring and household profiling more accurate and effective.

Recommendation: Review your profiling to keep it up to date, reflecting the effects of illness, bereavement and incapacity caused by the Covid pandemic. Make sure you know where your most vulnerable households are in 2021: use all sources of local and commercial data to keep at-risk lists up to date and know where support and protection from FRS is most needed in your community.

Blended data insight can help you identify the changing profiles and prevention and protection needs of households in your community in 2021. Get in touch with CACI’s FRS data specialists for help and advice on community segmentation and channel selection.

Understanding new supporter behaviours

In this Article

Covid has brought unprecedented changes to our day to day lives and our behaviour. This in turn is having a huge impact on the charity sector and their ability to fundraise, a vital part of their operations. Some of these key challenges that charities are facing currently are:

  • Not being able to host fundraising events
  • Loss of income from mass participation events
  • Charity shops being closed
  • Lower footfall on high streets and transport hubs
  • Economic impacts on income

At CACI we have been exploring the impact of Covid on people’s behaviour and we took a look at what this meant for charities and how they can overcome these challenges.

CHANGED PRIORITIES

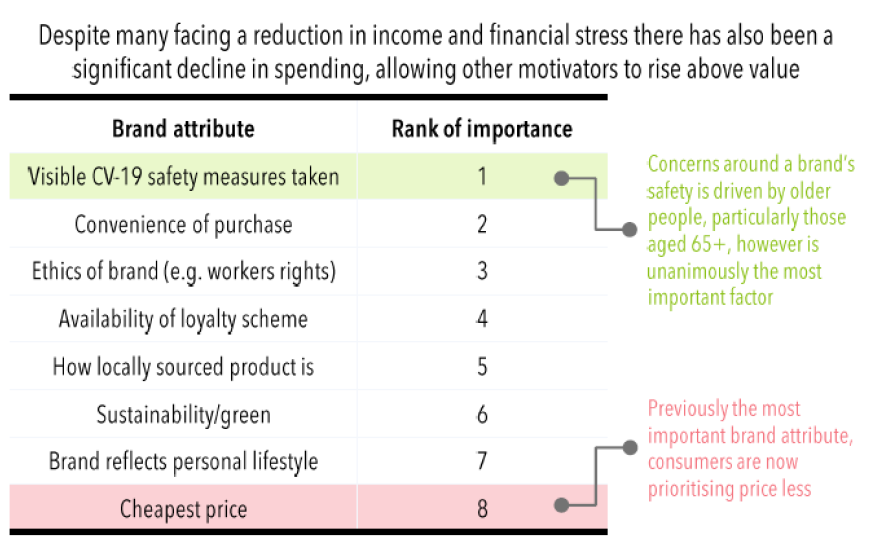
One of the more unusual impacts in people’s changed behaviour is the up-turn in their priorities when engaging with brands. Whilst Covid-19 safety measures have risen to be the number one priority, regardless of demographics, this was not the only change to the ranking. With a reduction in spending resulting from lockdown, two key aspects have risen to the fore in people’s priorities:

  • Ethics of Brands
  • Sustainability/Green

This is a key factor for charities as it shows that despite the hardships that many of the population is currently facing, there is a general desire to ensure money spent is done so with ethical and sustainable brands. This is particularly key for charities that have online stores as there is clearly an appetite for this kind of spending, so it is imperative to be reaching out to supporters with this message.

FINANCIAL SITUATIONS

Consideration of changes in income and financial status is imperative, but whilst Covid is having an impact on all, the effect of this is not the same across the board.

Using CACI’s Fresco segmentation, we have been able to look at survey respondents changed financial situations. The groups that are seeing an increased disposable income tend to be some of the younger segments that are early in their careers and have been able to successfully work from home. This is a key group to look at, as they aren’t the typical audience for charities to target as they usually have low levels of disposable income.

DIGITAL ADOPTERS

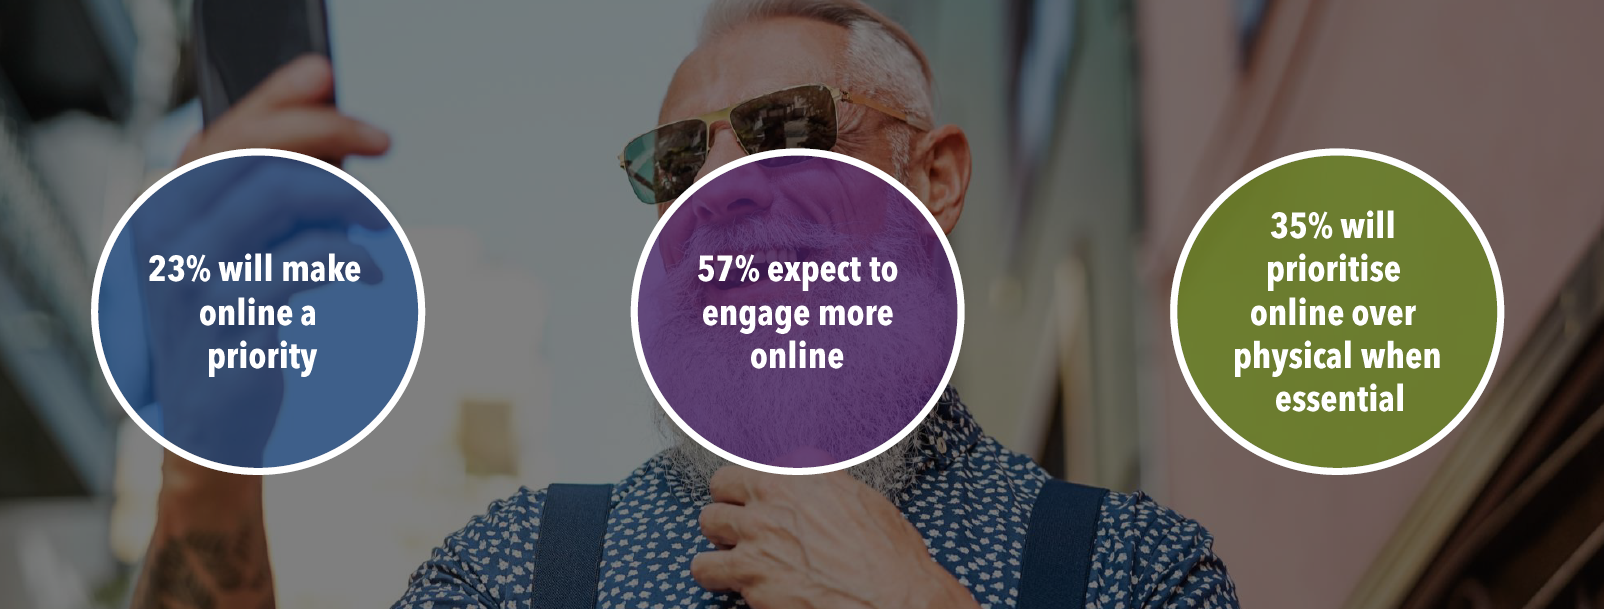
With face to face fundraising coming to an abrupt stop back in March, digital channels messaging for brand awareness and fundraising initiatives became a key strategy overnight. Since lockdown was imposed, we have seen that 53% of people are now expecting to engage more online. Breaking this down further, we can see that 23% will look to make online a priority going forwards, whereas 35% will only use online over physical when absolutely essential.

What is most important to consider in these statistics, is that it is older generations, typically adverse to using digital channels, that have now become more digitally savvy and more comfortable making payments online. As a key demographic for many charities, this is a key consideration in future fundraising strategy.

THE FUTURE OF FACE TO FACE FUNDRAISING

As restrictions have been eased and the tier system has been implemented, we have seen a rise in movement in the local community – whilst people are not moving in the same way that they were before lockdown, we can see that people are moving about and interacting more in their local community. This is key to consider when planning face to face fundraising strategies as the local high street is a more powerful location than before.

DISCUSSION

One of the key themes that was discussed is the importance in using data to understand what is changing in charity audiences. Whilst there have been some obvious changes with the loss of face to face fundraising and community events being cancelled or postponed, some of the changes in supporter behaviour are more subtle and being able to understand and react to these is crucial.

Some of the other key discussion points were:

  • Many charities are seeing an increase in digital donations – it’s key to understand who these donors are an ensure their retention and more importantly to continue to engage them.
  • Older donors are getting help from younger family members to donate online.
  • Direct mail and DRTV are proving successful – people are responding to the needs of charities, but data is needed to understand who and why.
  • Using value exchange and digital campaigns to attract a younger base of new supporters.
  • At this point in the year, looking forwards is essential – what does a fundraising strategy look like in 2021 with the lingering effects of lockdown and the tier system in place?
  • Improve online retail to recoup losses from retail spaces.
  • Retention of donors will be key for stability moving forwards.
  • Some charities have already started looking at younger demographics that have more disposable income than previously and engagement strategies here.
  • An unexpected bonus is that Covid has given space for internal transformative changes to come about quickly – for example, removing the reliance on particular channels such as face to face.

WHAT’S NEXT?

If any of these points resonate, and if you’d like to understand more about how CACI can support your charity to overcome this challenging time through data, marketing technology and insight please do not hesitate to get in touch.

Look out for our next blog on how charities can find and support the new vulnerable.

It’s all about demand

In this Article

Understanding demand is a key challenge for the water industry as it is a stepping stone in helping solve several puzzles such as distribution, understanding leakage, and helping customers reduce their water use. With some areas of the UK having low meter penetration, and standard meters only being read annually or even less frequently; demographic data is a key aspect in modelling demand to meet these challenges.

Recently, CACI ran a roundtable discussion on all things demand to understand how companies are tackling demand forecasting currently, and what innovations are being explored for the future. We ran the roundtable in conjunction with Anglian Water to share the work they are currently doing in this area, and Badger Meter who were part of the winning team at the recent “Innovate East” Hackathon.

USING DATA TO UNDERSTAND DEMAND – ADAM GRAY, ANGLIAN WATER

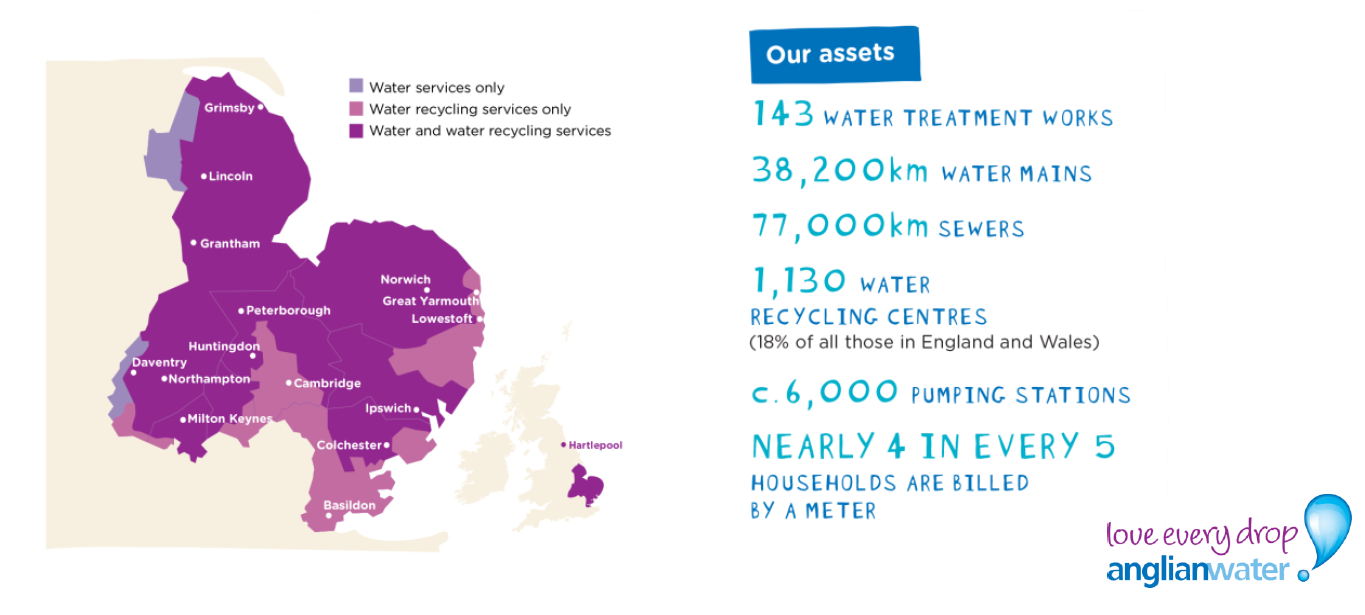
Anglian Water is one of the largest geographic water regions, spanning the East of England from Grimsby to Basildon. Unusually, Anglian has a 90% penetration of meters across their region.

One of the biggest challenges currently facing Anglian Water, as one of the driest areas in the UK, is climate change.  The increased risk of drought and predicted reduction in rainfall for the region is a huge concern for the demand of water.

Another major challenge that Anglian is tackling is the continually increasing population growth in the area. Located to the north and east of London, Anglian Water’s region contains 3 of the 5 fastest growing towns in England – Peterborough, Cambridge, and Milton Keynes. This means that in some areas the population could grow by more than 28% by 2045, again causing a huge increase in water demand.

To help tackle these challenges, it’s important to accurately understand the level of demand and therefore be able to calculate and tackle leakage in the area. To do this, Anglian use three main work streams:

  • First, the survey of domestic consumption (SodCon) for which Anglian has 2,000 domestic customers on flow meters, collecting data every 15 minutes. CACI’s geodemographic segmentation Acorn is used to ensure a representative sample of customers have the flow meters.
  • Secondly, for customers that are metered annually, Acorn is applied in conjunction with CACI’s Household Occupancy data to calculate the average daily consumption.
  • Thirdly, Anglian has approximately 17,000 customers on smart meters which collect hourly data. Acorn is applied to this data to again sort them into cohorts to build corresponding models.

The importance of smart meters in an area that is being increasingly challenged in terms of demand cannot be understated. Anglian has a programme in place to get 70% of their customers upgraded to smart meters by 2030, in order to further improve their understanding of how customers use water and plan for future local demand. Acorn will again be used in supporting the build of these models and to help quantify the day-to-day demand in areas that aren’t smart metered.

In addition, the smart meter data is a game-changer in terms of the understanding, modelling and reporting of leakage in a way that Anglian hasn’t been able to do before.

HELPING CUSTOMER SAVE WATER (AND MONEY) – ANNA CRISP, ANGLIAN WATER AND MICHAEL DAVIES, BADGER METER

At the beginning of September, Anglian Water along with Welsh Water and SES Water hosted the event ‘Innovate East’ – a two-week event focussed on innovation in the water industry. As part of the event, a data hack was held to explore what insights and actions could be driven from smart meter data.

The hack had the challenge statement of ‘Helping customers save water (and money)’ and teams were given Anglian’s smart meter data, along with occupancy data and CACI’s Household Acorn data to find innovative ways to approach and answer the challenge.

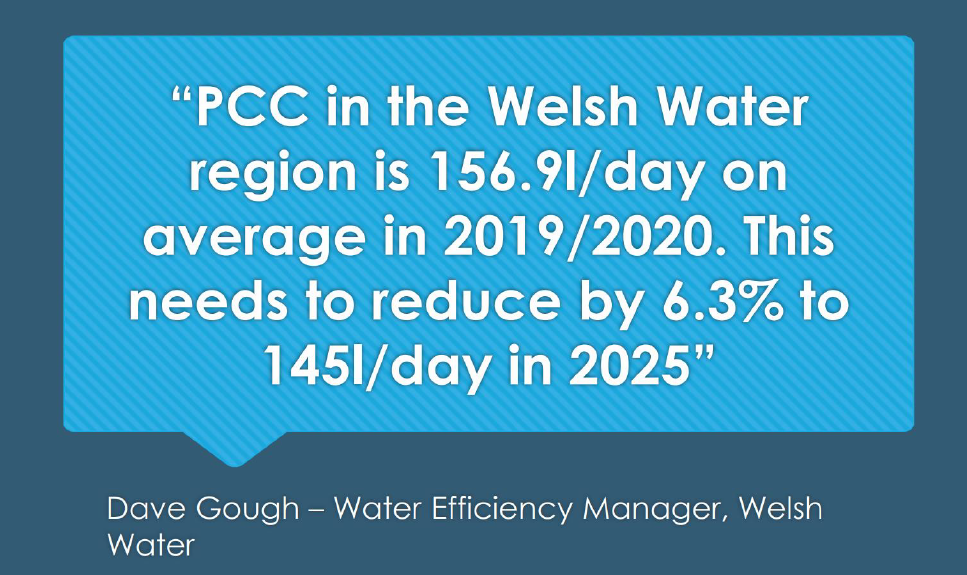
Using the above statement on the level of water reduction that is being targeted, Michael and the team approached this challenge with the focus on reducing customers waste use of water.

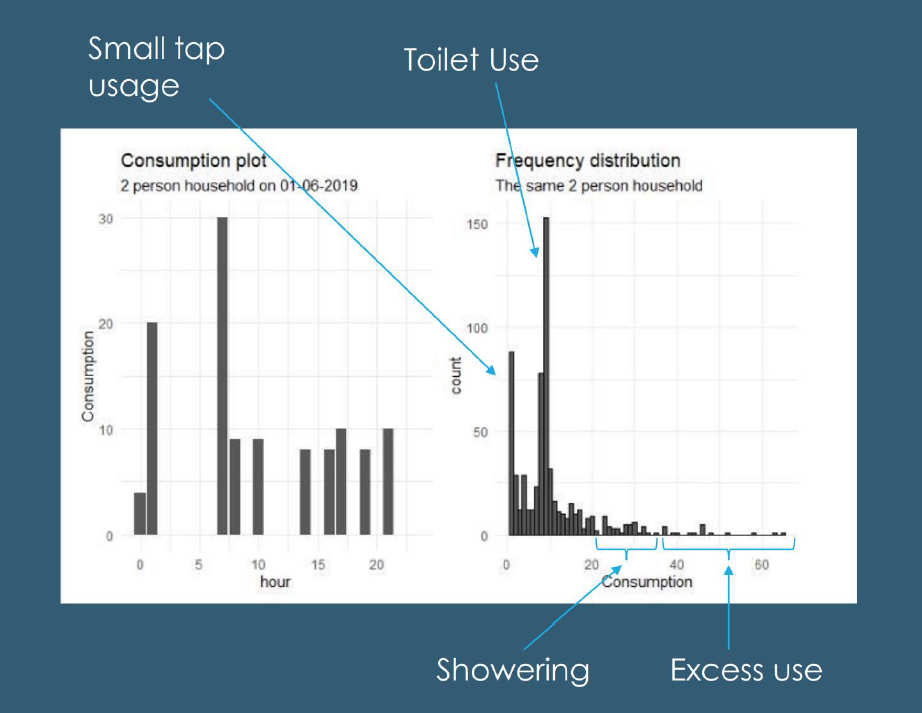
The first step in their approach was to answer the question – what is considered to be ‘excess use’? The team took raw data from a two-person household to look at an average day’s typical water use. From this, they were able to match behaviours to peaks on the graph as can be seen in the image below.

You can see that the activities with high levels of consumption, but low levels of frequency, can be identified as water being wasted and are the activities that are key to target to reduce water use.

By understanding the different ‘excess use’ patterns of different Acorn groups, this information can then be used to create personalised communications to customers to help them better understand their waste habits and to encourage them to consider alternative options. For example, being able to suggest a variable flush to reduce excessive water being used by toilet systems.

The team then proposed an app, ‘Pipedream’, to demonstrate how this would work. Using best practice from the energy industry as a guide, customers would be able to download the app and visualise their daily consumption against a set reduction target. The team also proposed adding options to demonstrate the change in water usage when different activities were chosen. For example, what happens to their water use if they decide to switch to baths instead of showers. This can then link into a reward scheme to encourage users in better water saving habits.

HOW ARE WATER COMPANIES APPROACHING THE CHALLENGE OF DEMAND MODELLING AND INNOVATION?

The roundtables also included discussion from representatives from other water companies sharing their views, examples of best practice and innovative ideas for future approaches to reducing consumption.

Points raised ranged from the importance of understanding the potentially contradictory view that larger households are naturally more water efficient than single person households (and how this can lead to flaws in using Per Capita Consumption (PCC) rather than Per Household Consumption (PHC) in demand calculations), to examples of how quality and timely communications have been proven to reduce water use.

Naturally conversations turned to Covid 19 and the clear evidence of changing behaviours and local demand, and potential ways in which this can be modelled and evidenced.

WHAT’S NEXT?

Look out for our next roundtable in the series which will be focussed on understanding the impact that Covid has had on financial vulnerability in the water sector.

Please do not hesitate to get in touch should you want to hear more!

Driving business decisions with real-time data

In this Article

APIs are not new news; they’ve been around for 20 years and have grown exponentially.

From powering ecommerce, social platforms and Cloud applications they have become ubiquitous since the explosion of smart phones. They improve integration and automation, leading to better services and innovation, saving time and money – linking both internal and external systems.

With 83% of respondents to The State of API Integration Report 2020 believing API integration is now a critical part of their strategy and 43% seeing a direct increase in revenue it is clear that this is the direction of travel for most organisations.

Added to this, the desire for most brands to provide a more personalised and seamless experience to their customers with 66% of consumers stating that content, that is not personalised, would stop them from making a purchase, real-time information is more important than ever.

To facilitate these real time business requirements, we have made our suite of demographic products available via our API, enabling organisations to access real-time insight about their customers directly into their marketing tech, consumer databases or websites.

The API enables you to code up new customer records instantaneously for immediate onboarding as well as providing insight across digital applications for content personalisation and messaging. With our API you will have the ability to improve business decision-making and user experience whilst achieving personalisation at scale.

THE BENEFITS OF A REAL-TIME API

CACI have taken the Acorn, Ocean and Fresco data products and made them available via our real time API. This allows for the coding of an individual instantaneously, and can change the use cases and application of the products. Here are just some of the benefits our clients are experiencing with CACI’s Demographic Data API.

– Immediate onboarding

Many organisations use CACI’s data products such as OceanAcorn and Fresco to plan the customer journey a new customer will follow as they onboard them. Understanding your audience’s affluence, lifestage, and lifestyle can make a big difference when creating tailored messaging and customer engagement strategies, by providing a view of the products your customer may be interested in, in the future. It is particularly important to get this right during the onboarding process as getting it wrong can affect the way a new customer perceives your organisation.

Knowing this additional insight at the start of the relationship can be immensely helpful, from knowing whether they are a Rising Metropolitan who may be interested in getting on the property ladder to an Asset Rich Grey who is planning for life enhancing expenditure or saving for their grandchildren, messaging can be adapted accordingly.

Similarly, if you are a leisure organisation, you might want to understand which shows your customers might be interested in attending in the future; adding CACI’s data can provide the insight you need to predict this while you build up a picture of their transaction habits.

– Siloed data

Another benefit of using the API is that it can assist organisations with myriads of siloed legacy systems containing customer information. It can be complex and expensive to pull data that is sitting on a marketing database, using the API can be a quick and efficient way to provide marketeers access to key pieces of information that drive their marketing communications programmes.

– Website and Email Personalisation

Identifying customers when they appear on your website enables you to serve tailored page content immediately, based on customer characteristics. Adding insight to a customer or prospect in a logged in environment or when they enter their postcode on a web form, enables instant journey planning and content personalisation.

For example, on a grocer’s website, a Successful Surbubs family will be looking for different products than someone who falls into the Student Life Group. Adding this colour to individuals, means that you can personalise content and create appropriate digital journeys which are dynamically adapted as they browse.

– Geo location

Additionally, at the point of placing a home delivery order, appending the geo location of the property can immediately assist in planning the delivery logistics, as well as helping drivers identify properties when on route, especially when it is dark or they are delivering in rural locations.

– Quote journey analytics

A number of our clients are interested in understanding the types of customers who drop out of the funnel during the quote process, compared to those that go on to convert. By adding key demographic, lifestyle or your own segment information to a record as it goes through the quote process, enables you to improve the effectiveness of your digital journey planning. Understanding whether a prospect might need additional reassurance or if they are more likely to be driven by price could affect the conversion path each customer follows.

– Providing insight to sales, customer service or chatbots

We also support our clients with bespoke APIs. For example, one organisation has a bespoke API system built by CACI, which provides real time insight to their inbound call handling teams for both sales and customer service applications, This allows for tailored scripts to be followed dependent on the customer segment.

With studies showing that it is likely 85% of customer interactions will be handled without a human in the future, providing demographic information in real time can provide different routes for chatbots to follow.

BEGIN YOUR REAL-TIME DATA JOURNEY

With the world moving to more automated ways of dealing with data and consumers expecting things to happen in real time, being able to understand your customers or prospects immediately can make a huge difference to the customer journey, maximising the revenue opportunities available to you.

You can discover more about CACI’s suite of consumer data products here, or to speak to one of our data experts and gain a better understanding of how you can integrate these products in real-time with your CRM system, websites and call centres, please get in touch.

Who are you?

As a philosophical question, you probably have a fairly good grasp of the answer when it comes to your own life.

However, the way businesses see us is patchy at best. Duplicated, incomplete, inaccurate data that is spread around systems creates an issue when it comes to generating an accurate profile of who an individual customer is.

When I consider my own data, I use multiple email addresses, have seen my surname spelt multiple ways, and use Dave and David interchangeably. My postal address can be written in endless ways depending on the input form used. It’s messy data.

Businesses will store this data across finance, operational, CRM and sales systems. You may notice this when you phone a call centre and are asked for policy numbers, order tracking codes, or some other identifier. It becomes more transparent that your records are split across systems and teams when that request is followed by “ah, I’ll need to transfer you to another team in that case…”.

It’s not just the data I provide either. Brands are tracking website visits, the content we consume, our social media interactions, and how we use their mobile apps. This tracking information can then be combined with my first-party data. This opens up further insight into my interests and intentions.

For example, if I’ve just purchased a product and start reading the returns policy on the company’s website, it should be obvious that I’m not happy and considering a refund. Brands that can use this data will retain customers, reduce services costs, and ultimately win share of wallet.

For customer focussed brands, Identity Resolution unlocks real benefits:

  • Advanced Personalisation: Utilising the full 360-degree view of customer data to serve personalised messaging across channels
  • Compliance: Ability to gather all PII data from across systems on the individual and to ensure responsible marketing in regulated industries
  • Improved Service: Less “screen switching” during customer interactions and the ability to pre-empt service problems
  • Accurate Analytics: Taking account of full customer data set to accurately measure loyalty or predict propensity to take certain action

Failure to get the full picture of who your customer is will lead to issues in making better business decisions that reach a customer. As the old-adage goes, garbage in, garbage out. We can’t expect our marketing to be optimal if it’s only utilising a small percentage of the data available.

To find out more information on Getting Started with Identity Resolution.

If you’d like to find out more about CACI’s real-time ResolvID service for identity resolution, get in touch.

Vulnerability in the water sector

In this Article

Covid-19 has meant that 2020 has been a challenging year for all sectors. With a lack of historical data to forward forecast the impact on consumers and their behaviour, there is no way to know what impact this will have on regulatory and business objectives.

For the water sector, this has been particularly challenging. Water companies have spent years building demand and leakage models to ensure that they are as accurate as possible.  With a significant shift in working patterns and individuals furloughed, working from home or made redundant; household consumption has increased dramatically, with a significant drop in non-household use.

On top of this, the UK saw a record breaking dry and sunny spring across the UK, quickly following the wettest February on record – adding further complicating factors to demand models.

Furthermore, UKWIR are working with the water sector to develop a strategy to “achieve zero customers in water poverty by 2030”.  With more customers at risk of becoming financially vulnerable, especially with the furlough scheme due to end this month nd further redundancies on the horizon, understanding which customers are at risk and how you can protect them is more important than ever.

Recently, CACI ran a roundtable to explore this latter point in detail and discuss how water companies can understand vulnerable customers and address water poverty.

We addressed this in 4 key areas:

  • Understanding those that are at risk of becoming financially vulnerable, pre-Covid
  • Using CACI’s movement of people reports to understand who is moving vs pre-Covid levels
  • Understanding how this movement compares to demographic groups
  • What water companies are doing to support vulnerable customers

UNDERSTANDING THOSE THAT ARE AT RISK OF BECOMING FINANCIALLY VULNERABLE, PRE-COVID

In January, CACI released Vulnerability Indicators to support organisations in understanding customers who are at risk of vulnerability from a financial and digital perspective.  The purpose of these indicators is to ensure that organisations are supporting those on lower incomes with appropriate tariffs and ensuring that those that can’t (or won’t) access services digitally are able to access services.

The Financial Indicators include the below attributes, as well as a combined score:

The Financial Indicators include the below attributes, as well as a combined score:

  • Basic Bank Account
  • Disposable Income
  • Young Dependents
  • Financial Situation
  • Likely to Borrow
  • Minimum Payments on Credit Card
  • Equivalised Income
  • Has a Loan
  • No Savings or Investments
  • No Pension
  • Distance to Bank Branch

The Digital Indicators include (as well as a combined score):

  • Broadband Access/Speed
  • Does not Have Mobile
  • Does not Buy Online
  • Does not Use Internet
  • Online Finance
  • “Computers Confuse Me”

USING CACI’S MOVEMENT OF PEOPLE DATA TO UNDERSTAND WHO IS MOVING VS PRE-COVID LEVELS

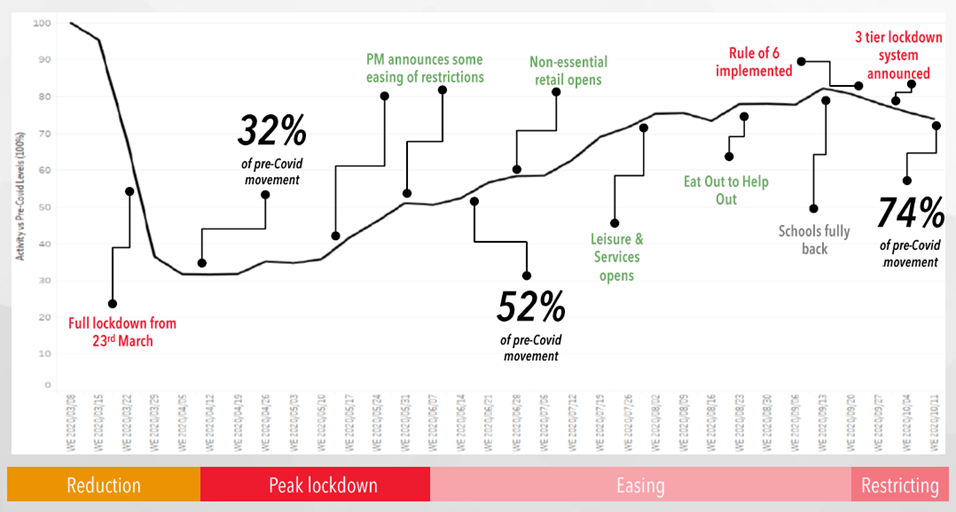
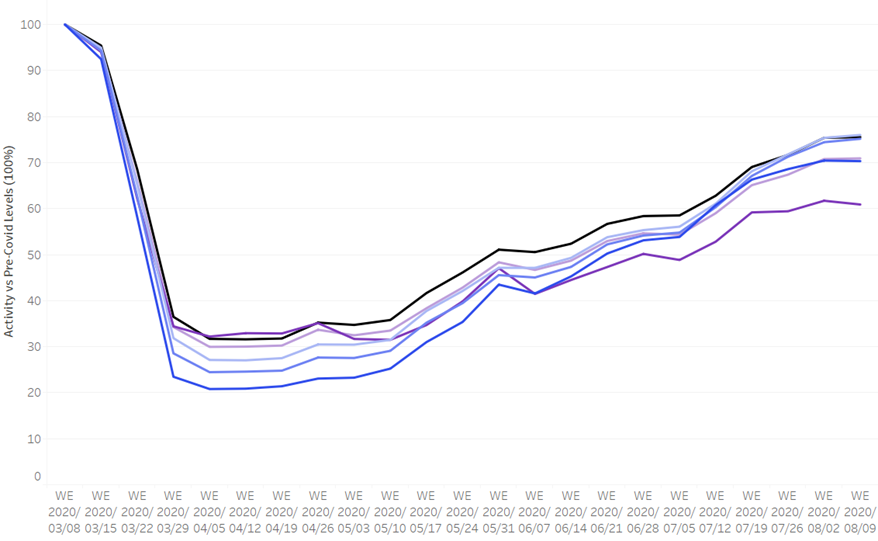
CACI has been running regular research surveys to a nationally representative sample on an ongoing basis, to see how consumer behaviour is changing. In terms of the latest movement, this is currently sitting at around 74% of pre-Covid movement, with decreased movement following the introduction of the tiered system in the UK:

UNDERSTANDING HOW THIS MOVEMENT COMPARES TO DEMOGRAPHIC GROUPS

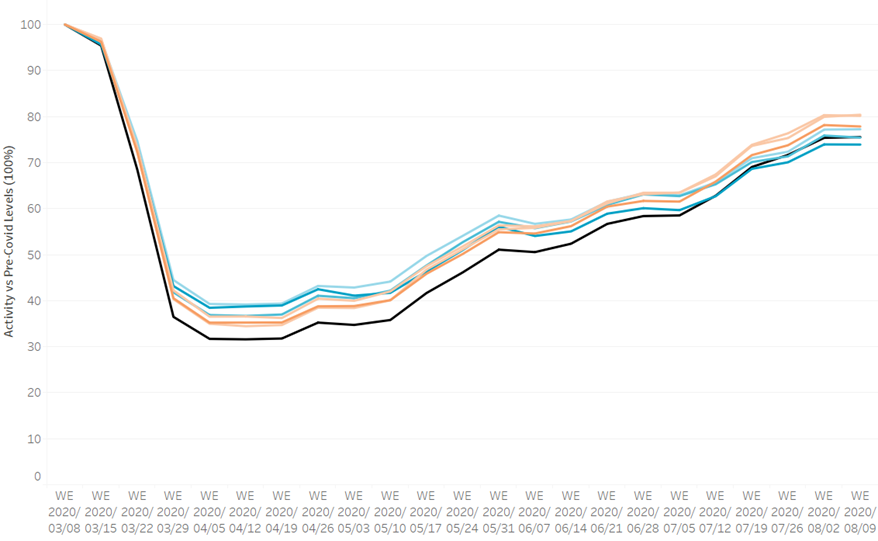
When comparing this to Acorn Demographics, movement is highly correlated to affluence, as you can see from this chart below. During Peak Lockdown the lower affluence groups were moving more than the national average (the black line in the chart below).  These groups are highly correlated to those working in the “essential” category, such as Care Workers and Retail Workers:

Compared to the more affluent, who were moving less frequently than the national average (the black line).  This is highly correlated to those that are “Office Workers” so are more likely to be able to work easily from home:

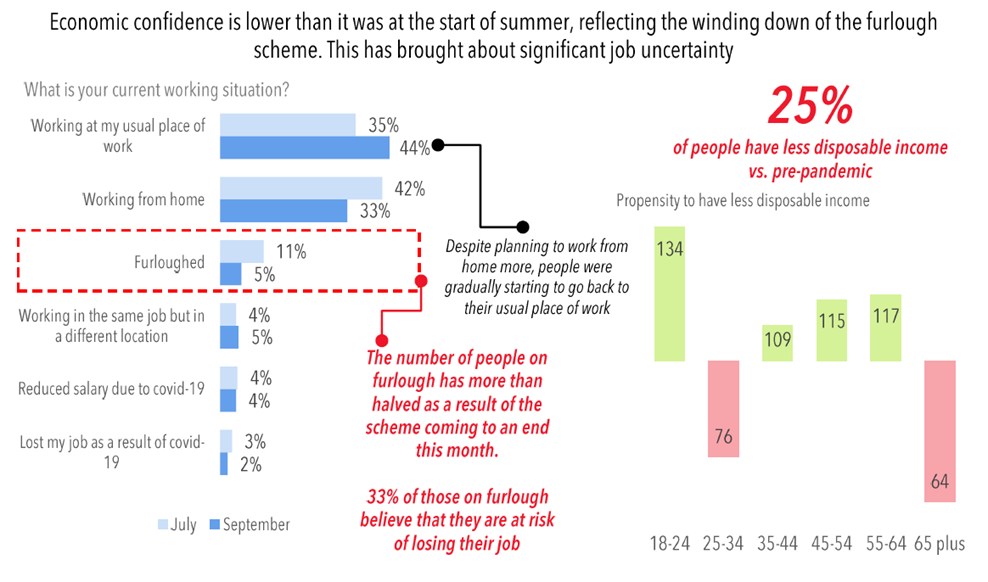
In addition, when we compliment this further with the research we are running, we can see that although the number of those on furlough is reducing, 33% of those on furlough believe they are at risk of losing their job, with 25% of people having less disposable income vs pre-pandemic:

WHAT WATER COMPANIES ARE DOING TO SUPPORT VULNERABLE CUSTOMERS

During the roundtable, we discussed a number of key areas that the attendees are focused on, to support customers:

  • A desire to be more proactive, rather than reactive and use data intelligently to understand those that are at risk. Some organisations are already using demographic, behavioural and contact centre data to understand vulnerable customers and how to support them – others are struggling to make sense of a very busy data world.
  • Consider partnering with organisations where consumers may go if they have not been financially vulnerable before. Linking with organisations such as Citizens Advice is a good place to start.
  • Some organisations where data is not easy to access are looking to partner with other utility companies to present a united front for consumers to access support.
  • Using additional channels such as Social Media and Press Releases partnered with National Debtline is a good way to reach audiences who may be at risk of becoming vulnerable in the future.
  • Also using direct channels such as pro-active emails to promote PSR and alternative ways to pay so you’re directly speaking to all customers (you can of course personalise this using CACI’s segmentations!)

WHAT’S NEXT?

Our next blog will be focussed on the impact of Covid on demand forecasting, following a recent roundtable we ran with Anglian Water and Badger Meter.

Following our next Roundtable on “Identifying the New Wave of Vulnerability” we’ll be releasing the key thoughts and findings.

Please do not hesitate to get in touch should you want to hear more!

CACI becomes an official Snowflake cloud data platform partner

In this Article

CACI is focussed on doing amazing things with data. For that reason, I’m really pleased to announce that through certifications and client case studies, we’ve achieved an official Select Partnership level with Snowflake.

Our clients have always relied on CACI to combine complex and large data sets to improve their business. Whether we’re bringing together data from across multiple brands and systems to build a 360-degree view of customer data, or analysing anonymous data from the UK’s major banks and lenders, we have expertise that brands can trust.

Snowflake is a cloud-based data platform that is gaining significant traction with CTOs. Snowflake is also one the fastest growing tech companies in the world and recently went public with a $60bn valuation.

Through its unique technology, Snowflake can power critical real-time use cases for CMOs and achieve improved time to value. Jon Ede who leads CACI’s Snowflake practice said:

I’ve built more SCVS and CDPS in my career than I wish to count. A lot of the functionality that a modern platform needs to deliver is out the box with snowflake, allowing for a CMO to cut down on the upfront implementation time and deliver value sooner. As a technologist who has spent most of their career working in marketing, I see immediate benefits of snowflake to a CMO.

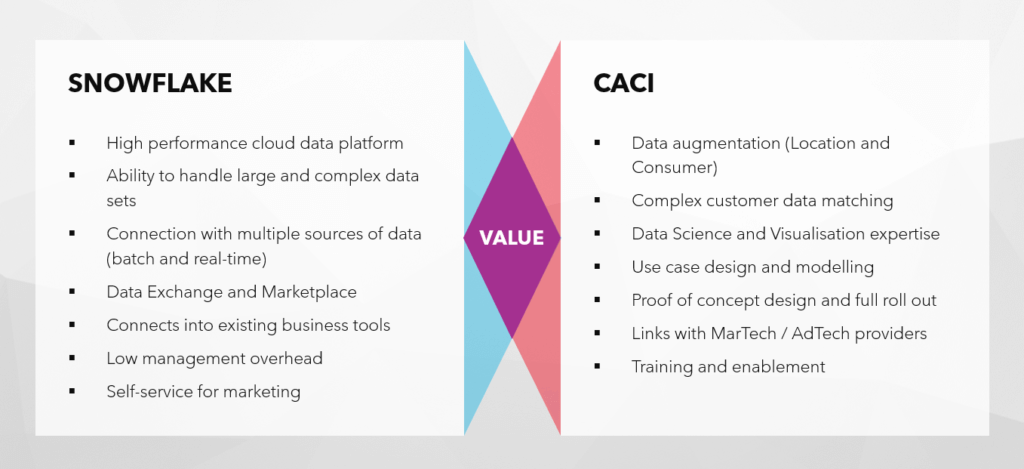
CACI and Snowflake for CMOs

CACI and Snowflake combined bring together a cutting-edge data platform with expertise in delivering customer marketing solutions.

Table showing the benefits that both CACI and Snowflake bring to CMOs with bullet points highlighting key areas and services that each partner can delive

As already demonstrated with our real-time Customer Personalisation Platform architecture that is built on Snowflake, CACI is developing answers for real CMO needs.

CACI has also integrated our identity resolution services into Snowflake, enabling marketers to bring together multiple data sets and, in real-time, combine duplicates. Improving the accuracy of reporting, attribution, and campaign selection.

Get in touch

Should you need help with your customer and marketing needs, get in touch with us.

Badge showing Snowflake Services Partner

Unlocking opportunities in social care with big data

At this recent Laing Buisson hosted event it was clear from the wise words of Daya Thayan, CEO at Kingsley Healthcare, that data is now critical to almost every aspect of running a successful social care business.

Daya eloquently and passionately outlined how, despite the challenges of this year, Kingsley are investing in their five-year vision to substantially expand their care home network.  Kingsley, along with many of our clients, are seeing that new, higher quality, purpose-built homes are increasingly attractive in the current market, and offering an opportunity for growth.

Tom Hall, Chief Economist at Barbour ABI mirrored Daya’s view of the market.   He clearly demonstrated how, despite inevitable drops in the planning pipeline for Care Homes at the height of lockdown, the sector is proving more robust than many sectors, and back on an encouraging upward trajectory.

Tom’s evidence was based on big data, sourced from Barbour ABI’s rigorous monitoring of planning applications.   Similarly, Daya’s search for his new sites is underpinned by data.  To give him confidence in the potential of the local markets for the long-term of his investments.

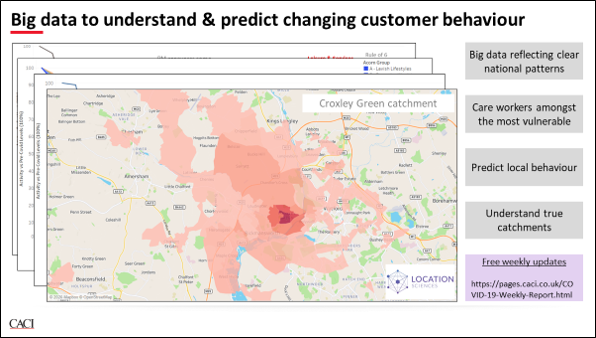
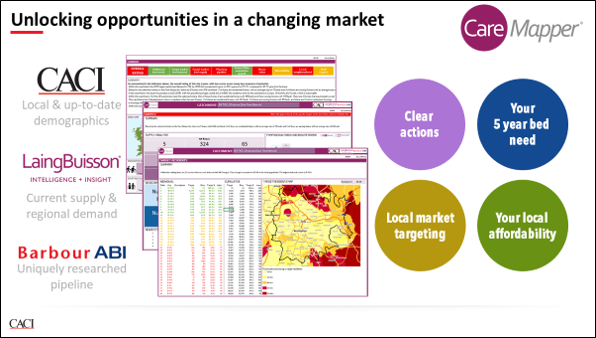
Recently at CACI we’ve also been using seriously big data sets, derived from Mobile Apps, to understand how different Acorn demographic groups have responded to the various stages of the pandemic.  Actual and potential applications of this data in the care sector include:

  • Demonstrating how care workers were more vulnerable to the virus when it was at its height
  • Prioritising the opening-up of care homes to visitors based on weekly movement levels in the local community
  • Planning local healthcare responses based on understanding current and potential future movement behaviours
  • Understanding the true catchment of care homes to support local marketing and communications.

Mobile App data is a recent addition to our existing big data sets that describe the lifestyles, attitudes and behaviours of the UK population.

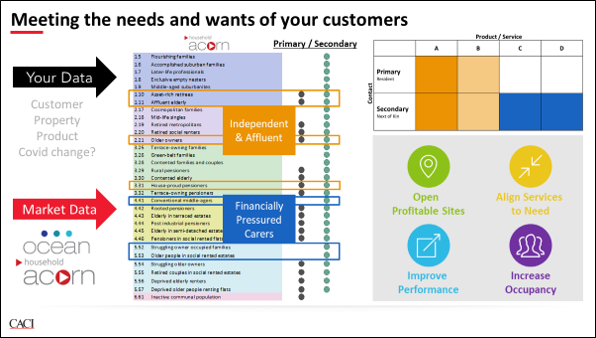
Daya, Tom, Laing Buisson and I all have access to different datasets.  They are all part of a jigsaw.  And when they all come together they have the potential to form a wonderful picture that helps to meet the needs and wants of customers and, in turn maximise, business returns.

Daya and Kingsley may be more data-savvy than some providers in the sector, but most organisations are also gaining bigger data sets on their customers and enquiries. Through your customer databases and CRM systems you know who your customer are, where they live and what products and services they need.  Also, by tracking this data over the Covid period, you can understand how customers and their needs are changing.

By linking this wealth of information with big market datasets you can really understand the nuances in the individuals behind this data. When harnessed successfully these data driven insights can help you to:

  • Open profitable sites – where your key targets want to live
  • Align products and services to meet their wants and needs
  • Increase your occupancy with cost-effective targeting using the right message and media.

All combining to improve your performance and customer satisfaction.

Are you, like many in the sector, looking to new properties, products, services or operating models to reflect the current market?  If so, you would be wise to start to put the jigsaw together for your business – and make the most of the data you hold and the powerful big datasets that complete the rest of the picture.

Build, build, build smart not hard

In this Article

Boris Johnson has issued a call to arms with “the most radical reforms to our planning system since the second world war.” “Build, build, build”; the message is as clear as the slogan. The UK is cutting the red tape surrounding residential development to allow quicker planning and to open up more unused or underused space to be developed into residential property. Not only this but the announcement of an increased £450million for The Home Building Fund creates an exciting prospect to see SME’s gain further support to build new homes.

An increase in supply is needed but through our use of analysis, our unique data sources and models CACI has been aware for a while that the “Field of dreams strategy” (build it and they will come) is no longer a suitable model. In fact, what is needed are developments that address the needs of the population at a localised level; needs assessed and measured against local population demographics. Although the new reforms that open up unused or underutilised space to transfer into residential should in theory address the supply issue, looking into the past few years of development I have good reason to be sceptical.

Below I will be addressing some of the key problems and solutions that all developers large or small should be planning and preparing for especially due to the uncertain times ahead:

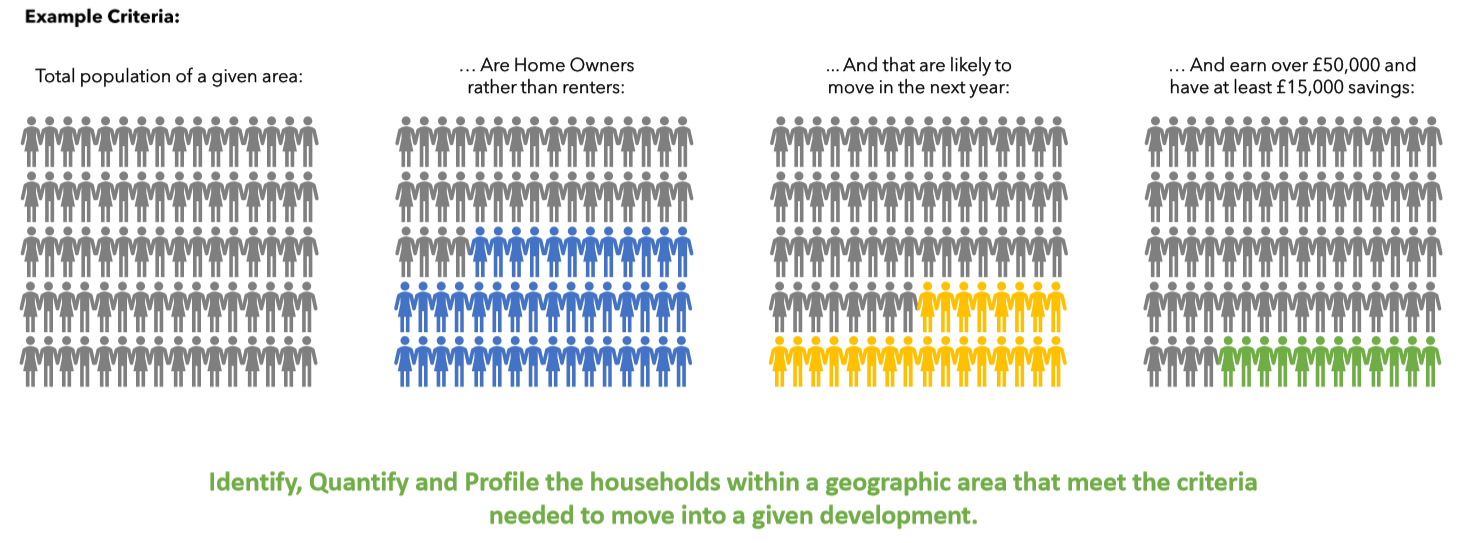
  • Understanding the catchment that your development will pull from, and who is likely to move to your location to inform what you build.
  • Using a diverse source of data to set smart prices and rent based on demand rather than supply.
  • How to get your development in front of the people most likely to move there and understand what messages resonate with them.

WHO WILL ACTUALLY MOVE TO YOUR DEVELOPMENT AND WHAT DO THEY WANT?

Tolga Necar, managing consultant at CACI, has profiled and Acorn coded new build houses across London and provided the following insight “50% of all New Build houses in London were Acorn Profiled as “City Sophisticates”; a group that accounts for just 25% of the London population. It is clear why these are an attractive target for developers; they are high earners and they are mobile (they are 67% more likely to move in a given year than the average person). But this oversupply of new builds means that each development is fighting for the same slice of the same pie; whilst other demographics across the spectrum are missed. Indeed, in London there are 49% more non-City Sophisticates movers than City Sophisticate movers so targeting just one narrow set of potential customers misses the substantial opportunity in winning with the 140,000 households from other demographic groups that will move.”

With this in mind it is no wonder that in London alone there was a value of £1 billion properties built but not sold last year. CACI is enabling developers to understand local demand by using our innovative catchment model to identify local demand and ultimately create an accurate correlation between the people likely to move and what they are actually looking for in a property across the UK. This in turn is successfully mitigating future risk and increasing profit margins for developers by increasing the volume of sales and occupancy on completion.

SETTING SMART PRICES AND RENT BASED ON DEMAND RATHER THAN SUPPLY

The margin for error has increased significantly this year and will do for years to come as the financial, societal situation and knock on effects of a pandemic are affecting individual households. Creating an accurate picture of affordability has been important but is now a necessity in a consumer led crisis. As a young private renter, I have witnessed first-hand the effect even the slightest difference in price can have on the decision of choosing between properties that on the surface are almost identical.

In 2019 Shelter conducted a study that found that almost half of working renters are only one paycheque away from losing their home. Carry that forward into 2020 with an increase in redundancy and lower salaries, the problem grows significantly. So why are we still so focused on pricing rental and sales on the supply rather than the demand? Within our models and analysis CACI has built in our product ‘Paycheck’ which is a dataset that provides consistent and reliable gross household income estimates from all sources including earnings, benefits and investments. We have also advanced this process to also look at disposable income which identifies: Income tax and national insurance, mortgage and rents, council tax, utilities, water bills and structural insurance, food and clothing costs, childcare, student loans and pension contributions and travel to work costs. This allows us to paint a more accurate picture of what your tenants and buyers can actually afford rather than what you expect they can afford or should be paying.

A more robust approach to affordability is not only important for the tenant but for the landlord/developer as competition for customers increases. With an expected increase in SME’s and a more diverse portfolio of developers it is important to make sure that you understand the customers in more detail than your competitors from a local to national level.

ENGAGE AND LOCATE THE RIGHT PEOPLE TO MITIGATE RISK

With new rental accommodation concepts hitting the market and increasing residential content in our feeds it is harder to stand out than ever. Unfortunately, blogs, brochures and videos are not going to make an impact if you don’t know where to market them or how to engage with your consumers. For years retailers and brands have been utilising location intelligence into their marketing so why aren’t developers? With the emergence of build to rent driving the property industries new concepts and features in a home, I would argue that properties in the private residential sector are as much a lifestyle choice as a roof over your head. So how do you know the difference between who is looking for a rental property with a gym and a balcony compared to a young family looking to invest in their first home. More importantly how do you find them?

Combining multiple variables to identify your target market is a great way of identifying the perfect consumer for your new developments. By understanding financials, lifestyle choices and lifestage we can understand who we should be targeting. CACI uses our unique datasets that are geocoded to enable marketers to do this in the same way we would identify the right location to develop in.

Once areas with a higher density of these consumers is identified we then need to drill down into their lifestyle choices and media preferences to engage with them. This doesn’t mean “are they online or offline?” but really understanding what they are looking for. It could be price, local amenities, on site facilities, location or all of the above. CACI understands there is a direct correlation between where people work, play and live so all must be considered when creating content for this particular set of customers. Once motivations are understood and the correct content is created CACI can then apply variables to not only understand who has a higher propensity to engage with certain content or media preferences but who is more likely to respond to that content.

From a household to postcode level of geography we can then locate the people who have a far higher propensity to engage and ultimately view your developments.

CONCLUSION

More houses need to be built to meet demand. Not understanding localised demand and affordability has been the Achilles’ heel of the residential market for a number of years. Where there is a high supply of housing that doesn’t fully meet the needs of the local demand, it has become increasingly difficult to sell them to investors or customers. A higher level of competition and supply has also made it difficult to reach and engage with the desired target market causing developers to fluctuate price or miss out on opportunity as the right customers are not seeing the marketing messages.

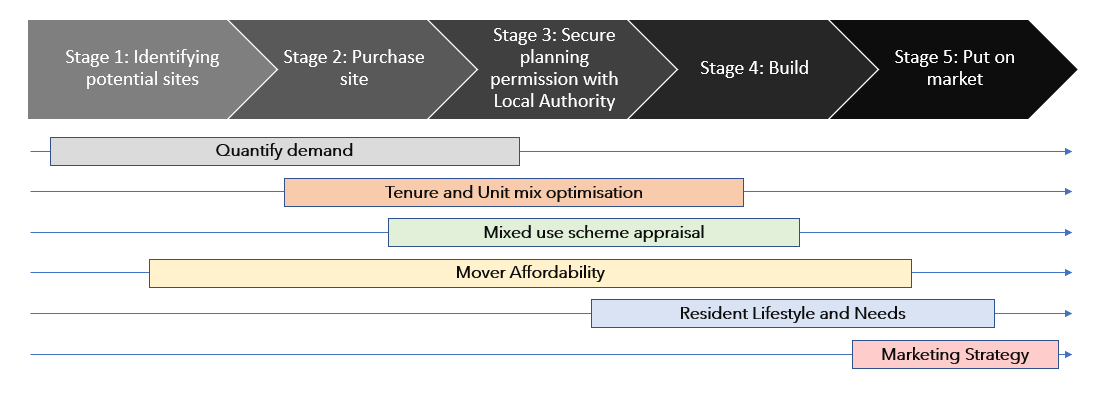
CACI understands people and place and in doing so can enable developers to build the right homes, in the right location, at the right price for the right people. Our new residential model can mitigate risk and increase the value of your developments at any point in the development cycle from first identifying a site all the way through to marketing and letting/selling the individual units.

In response to the ongoing situation and the ever-present housing crisis across the UK we will be releasing a white paper on residential movers and where to find them. For more information get in touch at twilson@caci.co.uk

Four tips for advanced email personalisation

In this Article

PConsider how many emails you get in a day. Even in the aftermath of GDPR, we bet it’s still a lot. Increasingly, people have very little time to read even the most important emails they receive.

So as a marketer, it’s vital to make the most of that tiny window. And personalisation is key to delivering content that a recipient will actually read – it’s no coincidence that one client we spoke to noticed an 18% uplift in revenue when sending more targeted messages.

When it comes to advanced email automation techniques, the best brands all have one thing in common: they use personalisation creatively, to make their campaigns more relevant, and meet customers’ increasing expectations.

PERSONALISATION: THE ONLY WAY TO CUT THROUGH THE NOISE

For the best performing organisations, personalisation goes way beyond the basic “first name in the subject line”. They use it to:

  • Relate to their audience through personal preferences
  • Deliver better customer experiences
  • Reduce churn and drive loyalty
  • Increase revenues

Personalisation doesn’t have to be complicated. For many time-sensitive communications, it can be as simple as ensuring you have the right information, at the right time, and aimed at the right person.

But it does rely on adhering to four rules, which every successful campaign needs to follow.

1 – Personalise From The Start

If you’ve overcome the first and most important hurdle of getting a subscriber to open your email, that’s great. But the bad news is the work is far from over.

There’s no point personalising the content near the end of your email, if your customer won’t get that far. You need to grab their attention by putting your most relevant and personalised content first. Or else they simply won’t read any further.

Just like you’d optimise your website structure, you need to ensure your most interesting and relevant information and CTAs – for that individual – are right at the top of the page. That way, you maximise the chance they’ll start to scroll down.

One client told us this simple structure change far outperformed any variations they tested in their email’s content or offers.

2 – Design Matters

For many leading brands, emails are a continuation of their website’s design. And having images with the same dimensions makes it easier to set up many personalisation options.

What’s more, by linking module copy and images from your website to your emails, the chances of making mistakes within an email is greatly reduced.

But it’s important to strike a balance: something that looks good, but that’s also very functional – and that the majority of email clients can handle.

And don’t forget to test how your design works across a wide range of devices. What works on a wide PC monitor may become fiddly and difficult on a small mobile screen.

Speaking of testing…

3 – Test And Learn. Constantly.

From big module structure changes, to minor colour or CTA tweaks, the importance of constantly testing what works can’t be overstated.

It’s the quickest and most accurate way to understand what individual customers like, and the reason why most major brands have transferred what they’ve learned from years of website testing over to their emails.

But one of the most important pieces of advice leading email marketers gave us is to not be afraid to fail.

Remember, a failure against the control is still a success, so long as you learn from it.

4 – The Future Is Real-Time Personalisation

For some leading organisations, real-time personalisation software like Liveclicker has proven a valuable asset.

We talked to one of our clients who uses Liveclicker on millions of emails each year. They said: “With real-time email changes, we have the ability to change time-limited offers or swap-out events that have sold out depending on when the email is opened. It puts us at an immediate competitive advantage.”

Especially if your inventory changes regularly, this may be something you need to seriously consider to stay competitive.

And if you want to take it that step further, AI – the ability to use machine learning that learns from subscriber behaviour to tailor the content of an email, where it’s placed, and in what style – is likely to be a game-changer surprisingly soon.

ADVANCED EMAIL AUTOMATION: LEADING BRANDS’ SECRET WEAPON

There’s no denying it, successful email marketing is hard. And as the number of emails increases – and customers have even less time to read even the most important messages in their inboxes – it’s only getting harder.

Every person on your database will cost you money to lose. So it’s critical you encourage them to stay and respond to what you’re sending.

Highly personalised and targeted emails – which are constantly optimised though a process of test-and-learn – are your best chance to help maintain and grow your database.

Your customers will not only thank you, but you’ll notice the results.

FOR MORE INFORMATION

tells you how you can overcome key challenges when it comes to delivering personalised customer experiences.

If you want to find out more about the amazing things we do with data, then feel free to get in touch.

What have we learned about our communities in response to Covid-19 and How can data be used to support our recovery?

In this Article

What Do We Know?

Data and intelligence has always been used by local government to better understand residents and communities as well as inform decision making associated with the prioritisation of resources and the delivery of services to meet need.

Although the Coronavirus pandemic has brought people together and promoted a feeling of community cohesion, it has also put issues within our communities including deprivation, social exclusion and health inequalities under a microscope. It is here where up-to-date insight is crucial if we are to tackle these challenges now and in the future.

If we take a look at the review of disparities in risk and outcomes published by Public Health England it outlines a variety of factors – many of which we’ve been aware of for some time – such as age, gender and deprivation where the virus has been felt the most.

It found that the largest disparity was by age, where people 80 years or over were seventy times more likely to die as a result of COVID-19 than those under 40. These disparities exist after taking ethnicity, deprivation and region into account, however do not account for the effect of comorbidities or occupation, which may explain some of the differences.

Areas of disadvantage and deprivation also have a much higher diagnosis and death rates than those living in more affluent areas. The mortality rates from COVID-19 in the most deprived areas were more than double the least deprived areas, irrespective of gender. These results demonstrate that there is greater inequality in death rates, due to COVID-19, than in previous years.

Although age, gender and deprivation feature heavily in this report, the analysis also shows that members of the Black, Asian and Minority Ethnic (BAME) community are disproportionately affected by COVID-19. People of Chinese, Indian, Pakistani, Other Asian, Caribbean and Other Black ethnicity have between 10 and 50% higher risk of death when compared to White British. And people of Bangladeshi ethnicity had around twice the risk of death than people of White British ethnicity.

Talking on ITV News (04.06.20), the NHS Chief Executive, Sir Simon Stevens said “There are very deep-seated inequalities in this country and coronavirus has shone a very stark spotlight on those. We can see that different groups, different communities are affected unequally by this terrible pandemic and that is going to have to act as a major spur to some very profound changes in the months and years to come”.

We have also seen an increase in those more financially vulnerable groups who have been affected by furlough, cuts to pay and redundancies as lockdown has progressed. Many of the people who have found themselves in these situations have turned to the benefits system and charities for help and support. This is supported by the Trussell Trust who have reported an 89% increase in need for emergency food parcels during April 2020 compared to the same month last year, which includes a 107% rise in parcels given to children. Furthermore; 48% of the increase in emergency food distributed from food banks is due to people reporting a fall in income from work or benefits.

Whilst these challenges may seem like a big mountain to climb and our recovery a long way off, data and intelligence is a key part of our roadmap out of lockdown and recovery.

How Can Data Help Support The Response Best?

Often, the first port of call for public sector organisations is Government data (Open Data) available via the Office for National Statistics (ONS), NHS Digital and Department for Work and Pensions (DWP). These are official sources and, since it’s on the Open Government Licence, free to use. But there are limitations: although a variety of demographic, health and income related data may be available these sources are rarely measured at low-level geographies and can be several years out of date.

Administrative data held by local authorities provides an understanding of residents who have made use of their services. Cross-referencing different databases can also help to give a more detailed picture of people who use more than one service. It’s a uniquely detailed source of data not available to commercial organisations.

In isolation, Open and Administrative Data only provides a snapshot of the bigger picture, preventing organisations fully understanding communities to be able to prioritise and deliver services to meet demand particularly in these unprecedented times.

As well as its scale, the beauty of commercial data is that it’s constantly refreshed. The data is kept up-to-date, and in some cases, real-time. This brings together digital activity and behaviours, postcode and household-level granularity and the ability to segment community groups to discover their needs.

It is for this reason that using a blend of data sources is so important, particularly when tackling something as big as COVID-19.

Furthermore; we are living through unprecedented times and this was recognised by the Secretary of State for Health and Social Care, Matt Hancock who tweeted “Public information: GDPR does not inhibit use of data for coronavirus response. GDPR has a clause excepting work in the overwhelming public interest. No one should constrain work on responding to coronavirus due to data protection laws.”

In April, CACI launched its COVID-19 local government data initiative with the aim of giving free access to up-to-date data and intelligence to local authorities. This insight has provided a detailed understanding of the demographic, lifestyle, behavioural and health characteristics of local residents, particularly those at-risk and vulnerable groups (over 70s and those who need to shield with underlying health issues) identified by the Government at the beginning of lockdown.

Many authorities who have been actively making use of data and intelligence to support their COVID-19 response and now recovery have typically benefited from the following;

  • Deliver relevant support to those disadvantaged residents who are financially vulnerable and those who face acute hardship
  • Better insight about those who are shielding
  • Understanding changes to those residents claiming benefits
  • Assessing increases in demand for specific services
  • Develop and implement communications and engagement based on preference
  • Prioritising the delivery of food parcels
  • Underpinning Council’ emergency response and recovery plans

In order to be able to understand the true effects of the coronavirus, data and intelligence about our communities will be crucial to support this Country’s move from response to recovery.

The Public Sector has faced significant cuts to funding because of austerity and the coronavirus pandemic has amplified this. In order to be able to deliver services to the at-risk and vulnerable members of our communities with limited budget and resources Council’s must make use of data and intelligence in a blended way.

To find out more about what this means for your residents and how we can help you better understand the communities you serve you can contact us now.

An interview with Braze: Keeping customers engaged in 2020

In the latest instalment of our Next Digital Decade series, David Sealey interviews Gareth Ballard, Vice President of Sales at Braze. They discuss the transformational changes that have occurred in marketing over the past ten years and how CMOs can harness these changes to drive the most value for their business over the next decade. Watch the full interview below.
Gareth explores how the exponential increase in technology over the last decade has dramatically changed the way that customers can interact with brands and what this means for your organisation.

“EACH TOUCHPOINT INCREASES YOUR CUSTOMER DATA, CREATING AN OPPORTUNITY TO INTERACT WITH YOUR CUSTOMERS IN A MORE MEANINGFUL AND HIGHLY PERSONALISED WAY”


He also discusses the trends that marketers should be leaving behind and those that marketers should be taking advantage of to retain their customer base, especially AI and machine learning.


“TECHNOLOGY SHOULD BECOME A CANVAS FOR CREATIVITY; NOT A LIMITER”


Braze recently published a report on how media streaming services have experienced a sudden increase in customers throughout March due to the amount of people who are now spending more time at home. These brands are utilising AI to predict their customers choices to work towards retaining these customers by impressing them with their customer experience so that they are not lost once this period passes.
Gareth gives his advice for how marketers can drive value this decade by stepping away from old techniques like batch and blast:


“MARKETERS NEED TO PUT THE EXPERIENCE ARCHITECTURE FIRST AND FOCUS LESS ON THE CHANNEL OR CAMPAIGN”


Gareth highlights the campaign that stands out in his mind as putting customer experience first – the Burger King Whopper Detour. Watch the video of this campaign to view how Burger King brought together a marketing stack, including Braze, to create this newsworthy campaign in the US!
If you haven’t yet caught up on our Next Digital Decade series, you can find part one here, where CACI’s Faye Dinnen discusses how digital marketing has evolved in the past decade.
In part two, we were joined by CACI’s Jon Ede, where we discussed how you can make the most of your marketing technology.


Coming up in our Next Digital Decade series, David will be sitting down with our Partner in Data Strategy, Ed Sewell.

A Cookie-less world

In this Article

Third-party cookies have been a fundamental part of the online marketing mix; an essential tool that allows brands to capture data on their audience, deliver targeted advertising and build customer profiles. In particular, cookies are at the core of programmatic advertising, which accounts for 90% of the total UK digital display ad spend of £5.81bn in 2019.

But, the cookie in its current form is not long for this world.

With the ongoing focus on customer data privacy, following the implementation of GDPR, there are growing concerns around third-party cookies and how they are collected, leading to three of the biggest web browsers on the Internet taking steps to block or phase out tracking cookies; Safari and Firefox blocked third-party cookies by default in 2019, whilst Google is planning to phase out the third-party cookie on Chrome, the most popular browser with a market share of over 60%, by 2022.

When combined with the fact that the ICO guidance explicitly states that the way many websites go about obtaining consent for third-party cookies is not compliant, it’s clear that things are going to have to change!

WHAT ARE THE ALTERNATIVES TO TRADITIONAL COOKIES FOR PROGRAMMATIC ADVERTISING?

Without the third-party cookie, the digital marketing landscape is going to need to evolve. Various methods to allow for tracking of customers and customer behaviour are already being discussed and developed as alternatives in this possible new cookie-less world.

For example, the IAB has grand plans for a standardised unique ID across the internet that would be an “improved mechanism for audience recognition and personalisation”. However, it sounds as if it will still be based on cookies and will need a lot of collaboration requiring a complex accountability system. If this proposed solution does happen, it will not be quick.

Numerous ad tech and analytics vendors are developing solutions for tracking that don’t rely on third-party cookies. Cookies have never been effective for mobiles, hence the mobile ad/device ID such as Apple’s IDFA or Google’s GAID. Whilst these systems still present privacy issues, companies like Apple and Google may be willing to work with advertisers to find a compliant method.

In addition, being able to effectively capture customer or prospect data to accurately identify, target and activate across multiple devices requires good technology. Managing campaigns across multiple marketing channels needs marketing automation, hence the rise of tools such as Customer Data Platforms (CDPs).

Digital fingerprinting – that is, using seemingly insignificant information like device used and browser plug-ins, in order to identify an individual – had emerged within the advertising industry in part to tackle cross device tracking issues which are inherent with ad IDs. However, Google, Apple and Firefox have already taken steps to implement anti-fingerprinting measures in order to deter advertisers from moving to this method in place of the cookie, making it unlikely to be a viable alternative.

WHAT’S THE RIGHT SOLUTION?

The truth is, there is no obvious alternative to the cookie just now.

It is likely the death of the cookie will benefit the large players, particularly Google and Facebook, as advertisers will be forced to use their first party data in walled gardens, meaning we could be moving to a blunter approach, returning to last click attribution.

To find out more about the impact of the loss of the third-party cookie on digital marketing and for further insights on what advertisers can do in the interim, download our guide – The End of the Third-party Cookie?


Understanding electric vehicle demand

In this Article

Understanding EV Demand

The steady growth in sales of Electric Vehicles (EVs) has been one of the few good news stories in the UK New Car market over recent months.

Almost all the major manufacturers have at least one EV model or are bringing one to market at some point in the next 12-to-24 months. But despite Battery Electric Vehicles (BEVs) being regarded by many as the only future for sustainable mobility solutions and the much-publicised Government target for zero emissions by 2040, the market is still comparatively small.

The Society of Motor Manufacturers and Traders figures show Battery and Plug-in Hybrids account for 2.7% of the 2019 New Car market to date and in total BEVs still account for less than 1% of all cars on the road.

And this presents an interesting challenge for Automotive Network Managers and Product Planners – how do you understand geographical demand for your models in an embryonic and sporadic market? The “traditional” approach of following the market through TIV (total industry volume) can’t be reliable when the volumes are still so low.

It stands to reason that demand for EVs will be determined by three main factors and each of these will vary geographically:

  • Consumer demand – who is likely to want to buy an EV?
  • Accessibility – how easy is it to own and operate an EV?
  • Wider “Push Factors” – external initiatives to increase awareness, consideration and ultimately purchase of EVs

At CACI we think that taking a data-driven and largely customer-centric approach to these questions can help the industry understand how and where to effectively target EV opportunity.

Consumer Demand

So who is buying EVs? In the early days of EV deployment it was often assumed that the younger urban sophisticates would lead the charge (no pun intended) for EV take-up. But there was always one glaring problem with this assumption – these people don’t buy cars!

Instead, anecdotal evidence suggested that EVs have been particularly popular with older rural customers. To some that might seem odd but if we think about it, it makes sense. These customer types are more likely to have lower mileage or infrequent usage patterns so any concerns about range become less relevant. The more affluent rural types will likely live in larger properties, so they have space for a private chargepoint. And research suggests that typically they are more likely to favour function over performance for their driving experience – although most EV models offer as good performance as their petrol/diesel counter-parts for many there is still a perception of a drop-off in this regard and for some types that can be an important factor in the consideration to purchase.

Of course, this isn’t to say that all EV customers are older rural types – far from it – but it is an example of how we need to think harder about the different motivations and characteristics of an EV customer and how this can help us understand demand.

Consumer Characteristics

So what are the likely consumer characteristics and motivations? I would say the top 3 are:

  • Higher disposable income (the price-point of EVs is higher than their petrol/diesel equivalent)
  • Lower annual mileage or likelihood to own two or more cars (so EV can be the second or even third “run-around” car)
  • Increased awareness of environmental issues and a desire to reduce environmental impact

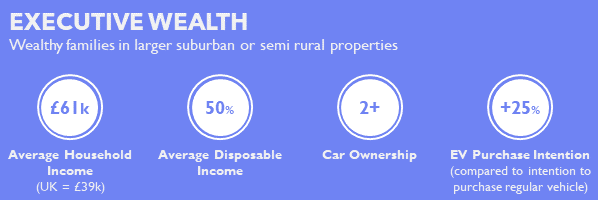
CACI’s research using Acorn and Kantar’s Target Group Index (TGI) shows those who have purchased or are considering purchasing, have many of these distinct characteristics, not least the prevalence among the more affluent Groups, particularly the older ones (Executive Wealth, Mature Money, Steady Neighbourhoods) but also the younger ones too (especially Career Climbers).

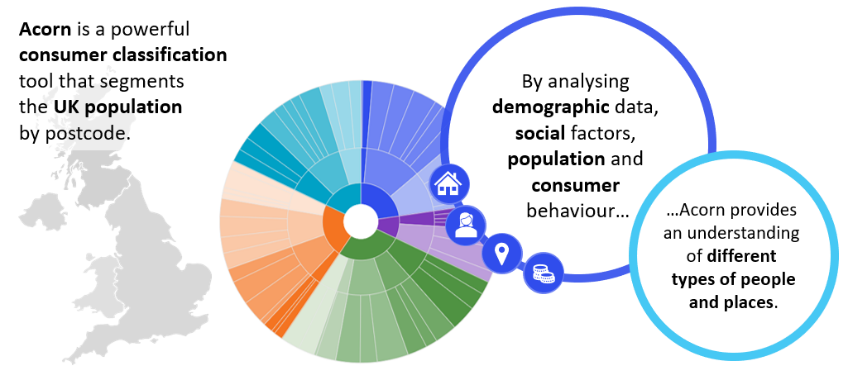
What is Acorn?

Panel research data can be used to identify consumer groups most likely to want to purchase an EV. Acorn can then be used to link this “purchase intention” to the UK population to quantify demand and also geographically target specific local markets. This answers the critical questions of: Who? How many? And Where?.

But understanding the profile of a “typical EV customer” will only get us half the way. Already, there is likely to be a difference between those who go for the more aspirational models such as Tesla, Mercedes EQC or Jaguar I-PACE and those who want the more affordable models such as Nissan’s Leaf, VW’s E-Golf or MG’s ZS EV. And the profile will change further as more and more models come to market at all levels of the price-point spectrum.

The great thing about the customer-centric approach is it can be tailored according to the model. By understanding which Acorn Types are most likely to take-up a specific EV, the size of the demand (and how best to reach them) can be established.

Below are 4 example Acorn groups classifications and their EV profiles:

Still, even after accounting for this, arguably it is just one side of the equation…

Accessibility

The motivation and means to purchase an EV is only one factor. The ability to own and operate one is also crucial and this leads to the critical question of charging. Most surveys of customers find that concerns about range are top of the list of factors that might dissuade from purchasing an EV. Some manufacturers have taken innovative steps to help customers get over this hurdle, such as Mercedes’ “EQ Ready” App which tracks your driving behaviour and tells you how much charge you would have left at the end of the day if you were in an EV. But nevertheless, access to chargepoints will be seen by many as a crucial factor in their decision to purchase.

Public chargepoints are becoming more and more available but their distribution does vary considerably. Measuring the provision of public chargepoints in an area is becoming easier as more data becomes available, some free to use (such as the National Chargepoint Registry or openchargemap.org), others on an annual license (such as ZapMap). And they reveal some interesting patterns in the provision of chargepoints. For instance, using NCR we can see that three of the Top 10 Local Authority Districts by number of chargepoints are in the North East.

But again, measuring public chargepoint accessibility in an area is only one part of the equation. Almost all EV owners will want to have private charging facilities at their own property. Very few would savour having to run a charging lead out of their front door or living room window onto the street. So while there are schemes, such as in Brighton, to provide chargepoints in lamp posts for those without, for the majority it is safe to assume that private off-street parking is an essential requisite.

No comprehensive dataset of private chargepoints exists yet, but there are ways we can measure how many properties have the capability to install one. The simplest of these would be to assume that a certain proportion of semi-detached and detached properties would have a drive-way and then use Land Registry data to quantify those, further narrowing it down by their freehold status. And a blended data approach could be taken to overlay the number of private vs rental properties (although some landlords might see having a chargepoint as an attraction in a crowded market).

A more sophisticated (and therefore expensive) approach would be to use GIS data to identify individual property footprints that are a sufficient distance from the road to indicate a driveway (or garage) and therefore space to install a chargepoint. One can also imagine satellite imagery and remote-sensing techniques being used to good effect here (albeit at a cost that might outweigh the benefit of the accuracy).

It is true that both these approaches will miss some things, for instance shared chargepoints in private parking for flats, but they still provide a good “all things being equal” measure of capacity.

Perhaps the most exciting developments will be with the employment of AI and machine learning to utilise resources such as Google StreetView to “spot” chargepoints and quantify. One can imagine many applications for this outside of the Automotive industry (again where the benefit might outweigh the cost).

And this data-driven approach can be future-proofed too. The Government is considering policy to make every new residential property with an associated parking space be fitted with a chargepoint. If that comes into effect then datasets that describe the level of new-build housing development in an area will be key in showing how demand for EV might change over time.

External Push Factors

The final piece of the puzzle here is the external factors that may encourage people to adopt an EV. Local initiatives (often led by Local Government) are key here. Many cities are rolling out schemes such as ultra-low emission zones (ULEZ) that restrict usage of certain types of vehicle and that might prove the push that some people need to adopt an EV. It will be instructive for Automotive planners to keep an eye on which cities will follow the lead of London, Bristol or Birmingham (to name but three) to see where EV demand could spike next. But it would also be wise to see what else is in play. Complementary schemes such as car-sharing, park and ride or cycle-to-work schemes might provide alternatives that might deter the take-up of EV in that area as people feel they can reduce their carbon footprint in other ways.

But with the “stick” to push people away from their current vehicles there also needs to be the “carrot” to help them adopt the alternatives. The Government grants for EV have already been cut once and any further reduction might see a substantial drop-off in the more price-conscious consumer types that might otherwise have considered an EV. Will they instead look for a cheaper used or nearly-new post Europe 6 Diesel or Euro 4 Petrol model (which are exempt in some clean air schemes) or downsize to a model with a lower emission rate? The impacts of these schemes could be felt in other areas of the Automotive industry, rather than just the take-up of EV, so again a geographical consumer-driven perspective is essential.

Understanding EV Demand

We have explored just a few areas in the multi-faceted world of Electric Vehicles. There are still some considerable hurdles to cross in terms of both public perception and infrastructure challenges before they reach the levels of ubiquity that are envisioned by some long-term forecasts. Until that point is reached the take-up of these vehicles will be driven by demand and supply.

At CACI we contend that a consumer-centric approach driven through data products such as Acorn, blended with other complementary datasets provides the means to estimate and quantify where Automotive manufacturers can best achieve success in this field. To find out how we can help you, get in touch.

Effective scheduling to effectively reduce driver fatigue

In this Article

AN ALARMING NUMBER OF DRIVERS ADMIT TO DRIVING WHILST TIRED – HOW CAN OPERATORS AVOID THIS?

Fatigue in bus drivers isn’t a common concern amongst members of the general public or, perhaps, those responsible for managing the schedules of drivers. In a service centred on delivery, considerations such as fatigue can slip down the pecking order of importance and drivers can be required to conduct more hours, at more anti-social times, than perhaps they should.

The results of this are stark: 21% of bus drivers in London say they have to fight sleepiness at the wheel two to three times per week and 36% have had a close call whilst driving a bus due to sleepiness in the past 12 months. This is according to a study conducted by Loughborough University’s Transport Safety Research Group.

These numbers are alarming, especially to someone who uses busses in London frequently, and it’s safe to assume that this isn’t a problem isolated to the capital. The causes, however, are altogether curable, cited as they are in the report as shift work and shift irregularity, sleep quantity and quality, and a disciplinarian culture giving rise to stress and mental overload.

SCHEDULING

The most important point is around scheduling. This is something that can be grasped immediately and have a positive impact on the problem. In a paper-based or manual environment where drivers check in at the depot to discover their shifts and routes, extra hours and unreasonable shift patterns can easily occur.

By bringing more transparency to driver scheduling, bus operators can enable their schedulers to deliver more efficient shifts to their drivers. In being able to more closely monitor shift patterns, operators can gain a far greater understanding of where fatigue is most likely to occur, leaving them in a stronger position to educate drivers and schedulers, thereby introducing a shift in culture which will reduce the risk of driver fatigue.

TECHNOLOGY

If this sounds straightforward, it’s because it can be. Efficient scheduling sits at the very heart of running a transport network and the tools exist to run scheduling in an online environment whereby scheduler and driver have complete oversight of their shift and shift patterns. Where schedulers can share rotas with drivers online instantly, drivers have a more efficient means of discovering their working patterns and schedulers have the means to take factors such as fatigue into consideration, offering them far greater control of the situation.

Once the scheduling element is sorted, company policy can be expanded upon to ensure fair and reasonable scheduling of those shifts which are most likely to induce fatigue, namely early morning and late-night shifts. These are the one that drivers most struggle to adapt their own sleeping patterns to, resulting in lower quantity and quality of sleep prior to and following certain shifts.

MANAGEMENT

Schedulers and management can also then easily identify where drivers are taking on too much work and/or have been taking insufficient breaks from their work, another red flag signposting potential driver fatigue. These breaks in driving are crucial in enabling drivers to maintain a balance in their work, whilst remaining properly hydrated and fed, thus helping to combat the onset of fatigue.

Scheduling of bus drivers is a complicated business with many factors to be considered. Delivery of a service to the public sits at the forefront of this but delivering this service in an appropriate manner is paramount. The cost of an accident can be incalculably high when all factors are considered and the risk is heightened by fatigue, yet fatigue is something that can be managed and mitigated with the correct scheduling tools and procedures.

If schedulers are properly equipped with the technology and knowledge to effectively schedule driver rotas, then the tools will be in place to begin to combat driver fatigue. Where 36% of drivers have experienced near misses in the past year as a result of fatigue, implementing the correct software to effectively and efficiently manage driver scheduling is hugely important. Is it a change that operators can afford to ignore?

Top 5 uses of customer segmentation

In this Article

As consumer expectations become more complex, and with brand loyalty increasingly more difficult to maintain, the need to deliver a personalised and tailored customer experience is crucial to your brand’s success. This is true across all industries, with consumers engaging across more channels than ever before, against a background of increasing competition.

What is Segmentation?

Segmentation is a fundamental tool for marketers, helping you to understand your audience by dividing consumers into distinct groupings based on shared demographics, lifestyle behaviours and attitudes.

When we think of segmentation, it’s easy to simplify the process. Grouping customers by products or services purchased, or demographic factors such as age or gender or perhaps we may go as far as segmenting based on buying behaviour. Assuming that two customers will respond in the same way to the same offer, based purely on their prior purchase or route to purchase is not necessarily going to achieve your desired outcome. Instead, gaining  deeper understanding of consumers and anticipating their needs as individuals is key.

Here we highlight the benefits of customer segmentation specifically for the financial services industry, however it is relevant across all industries and CACI can support all sectors with segmentation.

Financial Services Customer Segmentation

Fresco is an off the shelf segmentation created specifically for the financial services sector. It divides the UK into 12 segments and 45 sub-segments based on an individual’s life stage, affluence and attitude to money, providing a universal vocabulary with which to describe customers, prospects and the market.

Many clients have taken Fresco at micro segment level (134 segments) and combined transactional and market research data to reaggregate Fresco, building a powerful and bespoke solution tailored to their organisation.

Here are just 5 of the ways you can leverage segmentation to improve your customer experience.

1. Customer Insight

Financial marketers need insight to deliver the right message, about the most appropriate products, services and advice, to the right customers. Adding a segmentation to a new customer means you can immediately start to communicate to them in the right way whilst knowing limited transactional information about them.

Looking at customers solely through the products they hold could mean you are viewing two customers with similar mortgage products as being broadly the same type of person and communicating with them accordingly. But, when viewed in terms of the Fresco segmentation, those two customers might turn out to be two completely different individuals, with very different attitudes to life, money and risk.

Understanding whether your customer is a Successful Professional, a Stretched Renter or a Retired Homeowner informs the type of products and services they might be interested in and the types of channel and messaging they are most likely to respond to.

Fresco can provide strategic insights into your customers, enabling you to evolve communications to suit your audience at an individual level.

This detailed customer insight provides in depth analysis of your most valuable customers by Fresco segment, so you can start to find more like them. This could be anything from buying direct marketing lists or buying lookalike Fresco audiences using display advertising or connected TV to understanding area penetrations of Fresco segments for location of out of home advertising.

2. Proposition Development

The insights you gain when using a segmentation can also help you plan for the future. If you are attracting an older demographic and your customer database is dominated by segments such as Low Income Elderly and the Road to Retirement, you may need to review your proposition and develop products that are more suited to a younger audience, in order to expand your customer base.

Nationwide Building Society built a bespoke segmentation combining customer data, Fresco and market research allowing them to understand their individual members at a glance, and offer them the right products, services and advice to help them with their banking needs.

This new toolset helped Nationwide to better understand its customers’ needs, and develop compelling, targeted products, services and marketing messages, resulting in Nationwide winning significant new business among younger members.

3. Understanding the market

As well as understanding your individual customers, it’s also important that you have an overall understanding of the market in which you operate. Having a view of the UK population will help you to understand what share of the market you have and how your share is made up compared to the market as a whole.

Money Advice Service needed to understand the total UK market to ensure its advice services were reaching the right people, at the right time. To deliver accurate messaging, it was essential to Money Advice Service that they understood the different requirements of consumers and how to group them into addressable segments.

Fresco was used as a building block and mapped to research they had conducted, and the resulting segments have been used to help with targeting. This segmentation is used to build their engagement strategy and ensure support is focussed on the right customers, and that they’re targeting the core customer groups through appropriate channels.

4. Branch performance

The same philosophy can be used to understand local area analysis and branch performance. Understanding the population in the catchment area of each of your branches helps when making decisions about whether the branches are serving the local population with the correct branch format in a more digital world.

Fresco’s segmentation allows you to answer fundamental questions that will help determine whether your branches are in the right areas and serving the needs of your customers. For example, do they need the same size of premises? Should they be on the high street and open more convenient hours? Should they be providing financial advice for a younger audience or assisting in the transition to digital channels for an aging population?

With Fresco you can start to understand the needs of your customers and ensure your branches are operating in a way that suits the customers in the area, as opposed to every branch simply working in the same way.

5. Understand your audiences’ digital behaviours

By combining segmentations with digital consumer insight data from the likes of Hitwise, you can align your digital marketing tactics with the behaviours of your target audience.

When cross-referencing online behaviours with Fresco segments you can gain a better understanding of exactly what your audience are searching for and dispel any preconceptions of who would be behind certain search terms.

For example, it’s easy to assume that young professionals would be the primary group searching ‘first time buyers’, but Hitwise found it can also be Asset Rich Greys, as it is likely parents may be helping their children get on the property ladder. Knowing what your audience are searching for will allow you to feed these common search terms into your PPC and content tactics to ensure you’re attracting your target audience.

Similarly, understanding your target market’s online journey will help you to know where to make yourself most visible. If Asset Rich Grey’s are visiting aggregator sites, you need to be sure that your brand is present across these sites with the right messaging, to enable you to reach that target market.

To find out more about how you can leverage off the shelf segmentations in your marketing and improve on your customer experience, contact us.

The Wealth of the Nation 2019

In this Article

Every year CACI release their updated estimates of the income of households across the United Kingdom, with data indicating the average household income for every single one of the 1.7 million residential postcodes in the UK.

With the release of the 2019 data this Spring it provides a great opportunity for us to take stock of the nation’s finances, their disparities and some overarching trends.

Over the next few weeks we’ll highlight some our findings from analysis of the data in a series of blogs under the “Wealth of the Nation” banner, and provide informed opinion pieces on a range of topics including affordability of housing, the behaviour of the nation’s savers and a look at the underbanked, those without access to a full service bank account, and how their needs might be addressed.

These reports are authored by our very own subject matter experts who work directly with many leading organisations and well known brands across finance, local government, property, retail and other sectors.

But we’ll start today with a few headline numbers.

In 2019 the average gross household income in the UK was £39,800, an increase from £39,100 in 2018. Drill down and the differences become apparent. At a Regional level the South East has, not surprisingly, the highest mean figure at £46,400, and Northern Ireland has the lowest at £33,400.

London residents aren’t far behind the south east with a mean gross household income of £44,000.

London residents aren’t far behind the South East with a mean gross household income of £44,000. However, when you look at disposable income, once the cost of mortgage, rents, bills and other essential outgoings are taken into account, Londoners are actually doing worse than the UK average, with a net disposable income of just £13,600 against a UK average of £17,500.

Of course within London itself there is a huge income disparity, with a proportion of households receiving incomes far exceeding the national average.

Drilling further down we’ve identified the top 10 and bottom 10 Postcode Sectors in the UK by Mean Household Income:

Top 10 Postcode Sectors By Mean Annual Household Income:

  • EC3N 4 – London – £73,700
  • WD3 4 – Loudwater – £73,000
  • SE21 7 – London – £72,800
  • SW11 6 – London – £71,200
  • AL5 3 – Harpenden – £71,100
  • AL5 2 – Harpenden – £70,800
  • SW1Y 5 – London – £70,700
  • N20 8 – London – £70,500
  • AL1 4 – St Albans – £69,900
  • KT22 0 – Oxshott – £69,700

Bottom 10 Postcode Sectors by Mean Annual Household Income:

  • TS1 5 – Middlesbrough – £14,800
  • PA15 1 – Greenock – £15,000
  • B7 4 – Birmingham – £15,100
  • CH41 3 – Birkenhead – £15,100
  • B19 3 – Birmingham – £15,600
  • BT13 1 – Belfast – £15,900
  • L28 7 – Liverpool – £16,000
  • L5 0 – Liverpool – £16,100
  • L28 5 – Liverpool – £16,200
  • L20 8 – Bootle – £16,600

Top 10 Local Authorities by Mean Annual Household Income:

  • Elmbridge – £58,300
  • Richmond upon Thames – £58,000
  • St Albans – £57,500
  • Wokingham – £57,200
  • Chiltern – £57,100
  • Epsom and Ewell – £56,100
  • Hart – £55,400
  • Surrey Heath – £55,300
  • South Bucks – £55,200
  • Waverley – £54,900

Bottom 10 Local Authorities by Mean Annual Household Income:

  • Blaenau Gwent – £28,000
  • Knowsley – £28,200
  • Nottingham – £28,600
  • Sandwell – £28,900
  • Strabane – £29,100
  • Stoke-on-Trent – £29,100
  • Liverpool – £29,200
  • Kingston upon Hull – £29,300
  • Belfast – £29,700
  • Merthyr Tydfil – £30,400

By aggregating from individual postcodes we can understand and compare average incomes at any geographical level.

We can also do this across different demographic groups. For example, Manchester has the lowest average income for retired households of all Local Authorities at £17,900, whilst other demographic groups have proportionally higher incomes.

That said, retired households will, in general, have significantly lower outgoings, and the disposable income for retired households is often higher than for single and young couples. Equivalised income estimates provide a further means of comparison, taking into account household size.

Manchester has the lowest average income for retired households of all local authorities at £17,900, whilst other demographic groups have proportionally higher incomes

All this information has proved vital time and time again for our clients – decision makers and policy makers from all areas of business and government – to provide a detailed understanding of areas, key to supporting the needs of communities, providing appropriate services and to make sound commercial judgements.

All figures quoted in this article are sourced from CACI’s Paycheck and Paycheck Disposable Income datasets.

Do you know your ABC?

In this Article

Everyone knows that ABC1s are the most affluent consumers in the country. Right?

Honing your audience down to ABC1s means that your targeting is working. Right?

Setting your budget based on the number of ABC1s will ensure that your resources are going to the right place. Right?

Erm….not quite!

For years, every marketer worth their salt would trumpet the accolades of ABC1s. Back in the day (1960’s) they were seen as the pinnacle of wealthy, discerning, trend-setting consumers. These top three rungs of the social grade ladder were largely defined through the status of their occupation and thought to be more educated with better paid jobs.

In the past 50 years we, in the UK, have had a fundamental shift in the way we work as well as the industries in which we work and the roles we’re employed in. Gone are the distinctions between those in the office and those on the shop floor. Skilled manual workers are now as attractive to commercial entities as their bosses.

A huge 60% of UK adults are now classed as ABC1. That’s around 30 million people.

The problem with targeting ABC1s is that it isn’t actually targeting at all. A huge 60% of UK adults are now classed as ABC1. That’s around 30 million people. This might be good for those products and services which are used by almost everybody (e.g. petrol), but if you’re looking to get the most out of your marketing budget and still target the best customers a better approach is necessary.

A New Way

The Office for National Statistics (ONS) recognised this problem and have been creating a classification of small areas since 1971. ONS’s Output Area Classification (OAC) uses census data to classify output areas allowing public sector bodies to get a deeper understanding of local residents at the time of the most recent census. I would encourage anybody who is new to consumer classifications or segmentations to download OAC free of charge to understand the power of such an approach.
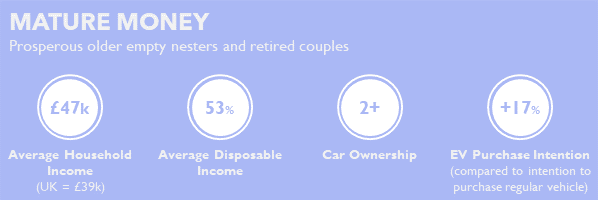
Further on from OAC are the highly accurate commercial segmentations. Acorn is ours.
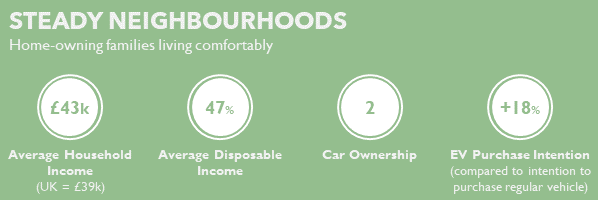
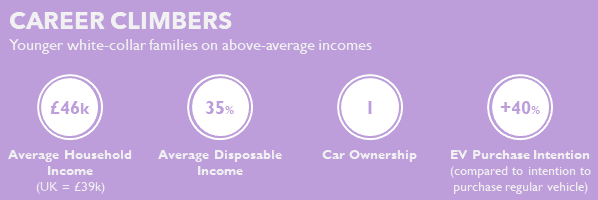
Acorn was the first commercial geo-demographic segmentation in the UK, created way back in 1978. Since then it has been rebuilt with the release of each census. The most recent incarnation has had a major methodological overhaul and does not rely on any census data but uses, amongst others, Open Data sources which are updated much more frequently than the decennial census, resulting in a very up to date, very accurate postcode level segmentation.

1.1 Billion Data Points 1.1 Billion Data Points

Classifications like Acorn allows marketers to hone their audience, refine their message and perfect their channels. Acorn uses 1.1 billion data items to classify each postcode into 1 of 62 types and a further 800+ variables to help describe and understand each one.

So, if you are looking to market your product/service to wealthy families in suburban neighbourhoods, there are a couple of types which match your target resulting in an audience of around 2 million households or around 7.5% of the UK.

From the above mentioned 800+ variables that help us understand them, we can infer that these customers:

  • Tend to shop for premium goods rather than standard
  • Shop online, not for bargains, but for the convenience
  • Are more likely to respond to direct marketing where they are referred to by name
  • No more likely than average to use social media
  • Use the internet daily:
    • Sites regularly visited include; John Lewis, M&S, Selfridges, Net-a-Porter
    • Regular users of services such as banking, insurance
    • Booking tickets (airline, events, travel and holidays)

At the other end of the spectrum, a local authority may be looking to increase recycling rates. The 800+ variables now helps to decide which neighbourhoods should be targeted and more importantly which should not.

Simple analysis shows that young, educated people in urban neighbourhoods tend not to need to be told to recycle so targeting them with environment messages regardless of channel is a waste.

The make up of ABC1s makes them a very difficult audience to market to. Imagine trying to create an eye-catching message that engages and resonates perfectly with all 30 million people. On top of this you’ll also need to try and choose the right channel that will deliver this message at the right time! This is what targeting ABC1s is fundamentally trying to do. By ‘targeting’ such a large proportion of the population, marketing messages (and marketing dollars) are diluted to a point that they don’t target anyone.

So you may know your ABC, but do you know your ABC1s? In the 21st century its time to learn a new alphabet – A.C.O.R.N.

Acorn explained

In this Article

Acorn is a powerful consumer classification that segments the UK population. By analysing demographic data, social factors, population and consumer behaviour, it provides precise information and an understanding of different types of people.

But where does it come from, and how is it built? In this blog we look at the methodology behind Acorn, the data used to build it, and some important differences in classifications.


What is Acorn?

Acorn segments postcodes and neighbourhoods in the UK into 6 Categories, 18 Groups and 62 types, three of which are not private households. By analysing significant social factors and population behaviour, it provides precise information and in-depth understanding of the different types of people who live in a particular area.

With this information you can learn more about your customers’ behaviour and identify prospects who most resemble your target customers, define local demand for products and services and understand what drives effective customer communication strategies.

Methodology

The methodology that Acorn and its counterparts use to create segmentations has essentially remained the same since CACI created the very first consumer classification in 1978.  Census data is used as a foundation on which to build the segmentation – it contains the same data for everyone, everywhere regardless of whether it’s relevant or not – add to this some proprietary lifestyle data, do some k-means clustering and et voila! – you’ve got a consumer classification.

The consultation, Beyond 2011, identified the need to change the way in which the Census is collected (currently it’s a pen and paper exercise) to take account of new technology, cost savings and changes to data protection laws.  We realised the implications of these changes and embarked on a 2-year investigation into other techniques and methodologies in order to create a better and more accurate version of Acorn.

In November 2013, we were the only commercial company able to demonstrate our new classification at the DMA’s decennial conference, Tracking A Decade of Changing Britain.  The new methodology to build Acorn is no longer reliant on the Census, instead we are able to effectively utilise data from a variety of sources.

One of the key methodologies allows new neighbourhoods, regenerated areas and other areas of wholesale change that have occurred since the Census to be properly identified using a specific algorithm to identify and correctly classify new build areas.  This is to ensure that Acorn is always as up to date as it possibly can be.

ONE OF THE KEY METHODOLOGIES ALLOWS NEW NEIGHBOURHOODS THAT HAVE OCCURRED SINCE THE CENSUS TO BE PROPERLY IDENTIFIED

Data

So outside of the Census, what data goes into Acorn? Over the years we have researched a vast array of new data sources.  The Open Data initiative has provided a great source of new data that is constantly updated and available at small area level.

Alongside this, we buy in a number of 3rd party data sets, including a dataset of all retirement living developments, data from the Land Registry and rental data from the UK’s leading online property portal.

We have also embarked on the creation of our own datasets, such as student accommodation and the locations of high-rise residential buildings. The advantage of having these data sets allows us to segment hard to classify neighbourhoods.  As the lifestyle and consumer habits of students and those that live “vertically” differ considerably from standard residential neighbourhoods.


IT IS IMPERATIVE THAT ANY CLASSIFICATION USED TO TARGET YOUR CUSTOMERS ISN’T RELIANT ON DATA THAT IS NOW OVER SEVEN YEARS OLD


Postcode vs Household Level

Acorn is also available as a separate classification at address level called Household Acorn.  We believe that the way one describes a neighbourhood (i.e. postcode) is fundamentally different to how a household is defined. This differentiation ensures accuracy. Where the size and composition of households within a postcode significantly varies, using the same classification for both can become extremely imprecise, depending on how the classification is being used.

For example, imagine a typical street in Britain with 15 households. 14 of those households are occupied by couples in their 50s-60s, where their children have left home.  This neighbourhood can rightly be described as a community of empty-nesters.

The one remaining house in the street houses an elderly, single woman in her 80s.  A household classification would be able to identify this household in isolation from its neighbours.

A simple calculation would tell you that there are enough single, elderly women living on their own across the country to constitute having their own household segment.  But, there are nowhere near enough neighbourhoods or streets where the dominant house type are single, elderly women.  So, a compromise must be made on the accuracy of either the postcode segmentation or the household classification.


An Insightful View of your Customers


There are many consumer segmentations and classifications allowing you to target different consumer types, all based on a methodology that CACI invented 40 years ago.  The latest incarnation of Acorn however, is something different and fresh.

With the rapidly changing nature of neighbourhoods and the speed of redevelopment happening within many of our cities and towns across the UK, it is imperative that any classification used to target your customers isn’t reliant on data that is now over seven years old.

Acorn utilises the latest data alongside a new methodology to give the most accurate and insightful view of your customers, service users and prospects available.
 
You can find out more about Acorn and discover which Acorn segment your neighbourhood belongs to here, view the product sheet, or get in touch to find out how Acorn can help your business.

The Demographics of Building Homes: Who’s Likely to Move In?

In this Article

As residential building becomes increasingly competitive, developers need to take a more strategic approach to how, what and where they choose to build – and who they build for.

We’ve previously looked at how data from our Ocean database, combined with the Institution for Social and Economic Research’s Understanding Society study, helped us to identify ‘likely movers’ – those with the highest propensity to move within a year – and where they currently live in the UK.

This data doesn’t just offer information about the location of potential movers – we’ve also been able to dig deeper into the demographics that make up the 8.6 million people most likely to move in the next 12 months.

Segmenting The Likely Movers

For developers, understanding the potential customer is key to shaping the offering they build. We used Acorn, our demographic classification tool, to build more detailed profiles of the different target markets.

Acorn segments the UK’s households, neighbourhoods and postcodes into six broad categories and 18 specific types, defined by basic characteristics such as age and income, and more in-depth factors, like lifestyle. By sorting our information about likely movers into Acorn groups, we’ve identified the top five groups that have the highest potential to move in the next year:

  1. Student Life
  2. City Sophisticates
  3. Young Hardship
  4. Career Climbers
  5. Starting out

The ‘Student Life’ group, which is part of the ‘Financially Stretched’ Acorn category, are five times more likely to move than the UK average. This is largely to do with their life stage, as they often live in shared, purpose-built student housing or short-term private rental arrangements while studying. Many will move multiple times during their student years – and will often move into their first non-family home when they graduate, which is an obvious opportunity for developers.

Using these Acorn classifications, house builders can answer a vital question: “who do we want to buy our properties?” By identifying their ideal market – whether that’s students, people moving into cities for work, young families just getting started, or elderly people moving into retirement homes – residential developers tailor both their builds and their marketing campaigns to deliver a faster return on investment.

Finding Tomorrow’s Customers

However, simply knowing who you want to target won’t be enough. Developers also need to consider when they will be targeting their chosen group.

No person stays in one Acorn group throughout their entire life. And that means their needs and interests will change as they move from one category to another. Say the development will be a purpose-built private rental scheme aimed at Career Climbers – if the build takes 18 months, by the time it’s completed many of the Career Climber group will have progressed into another category, such as City Sophisticate.

That means developers need to anticipate their future market – the renters of tomorrow, who will be building their careers and becoming potential customers. Using Acorn data, we can help developers plot ‘lifecycles’ for their target markets, helping them identify which sections of the population are likely to be in their target market when a development is finished.

This gives new developments a key advantage: rather than finishing a build, then advertising to the target market, developers can reach their potential customers before they’re even ready to move.

Understanding Potential Buyers

Finding your audience ahead of time is undoubtedly the key to unlocking the fastest possible return on investment from your next development. Our unique population data and analysis also lets us dig into where likely movers live now, how their income affects how much they can afford to spend, and the amenities they look for in their next home.

If you want to hear more about how CACI’s Property expertise can help you, get in contact now.

The 3 pillars of digital marketing strategy (Which one is failing you?)

In this Article

Whether your challenge is acquiring more leads, converting prospects or creating more value from your customer base, digital marketing success is almost impossible without the right data, technology, and people.

There are three key digital marketing pillars available to digital marketers: data, technology, and people.

By themselves, each serves a purpose, but they’re often siloed and inefficient. Combine them together, though, and you have the foundations for highly effective digital marketing strategy.

Data, tech, and pData, tech, and people: the three digital marketing pillars

When we ask digital marketers what their greatest challenge is, it’s almost always that they want to maximise the value of their existing customer base.
And for many, this is more of a priority than attracting new customers.

Little wonder really, when on average it costs around five times more to attract a new customer than to retain an existing one. And when you consider the volumes of data brands now have at their disposal but don’t use, the potential to extract far greater insight on their customers is immense.

Truly, data is your most valuable asset by far. But without the technology, structure, and process in place to support it, that asset can easily go to waste.

Data: comes in all shapes and sizes

There’s a whole host of data available to organisations which can come from a variety of different channels and activities:

  • Demographic data – who the users are and their interests
  • Behavioural data – customer activity to date
  • Contextual data – what’s happening in real-time

Technology: the great enabler

On its own, technology won’t solve a thing. But combine it with the right data, and the talent needed to interpret it, and it can bear significant fruit. Three broad types of technology have important roles in your digital marketing stack:

  • Facilitative – external tools which are developed by third parties and are often ‘off-the-shelf’
  • Web analytics – to measure customer activity and behaviour online, including bespoke reporting
  • Internal – self-developed systems meeting your unique needs, which can’t be bought ‘off-the-shelf’

People: the human piece of the puzzle

As we know, people come in all shapes and sizes, and digital marketing is no exception. To get the most out of yours, though, you’ll need to stay on top of:

  • Team structures and skillsets – the make up of your team and who does what
  • External suppliers and agencies – the skills your team needs to outsource
  • Management levels – understand how data flows to management teams and how it will be interpreted

Combining Digital Marketing pillars for ultimate success

When you combine the forces of data, technology, and people, you create a self-populating circle of information and insight. Each one informs the other.

Without data, most tools and technology are completely useless. And just like a purchase database is useless without data, an Email Service Provider (ESP) relies completely on data to work effectively.

If the right technology can’t feed this data back to marketing and other teams in turn, it’s incredibly difficult to extract the right insight, which is critical to optimisation and marketing activity development.

And the reverse is also true, if you want to truly maximise opportunities to grow your customer base. There are scores of technologies that produce, rather than consume data. Tools like web analytics software constantly produce customer activity records which are then fed to marketers. And how this data is used is ultimately up to the people in the organisation.

But technology can also have a significant impact on the people in organisation. For a tool to succeed, it needs the right aptitudes, skills, and personnel. It can even make some roles redundant.

ig 1: The three pillars of digital marketing and how they fuel one another.

We tend to find that most organisations focus on one or possibly two of these elements. Some marketers have a deep opinion on which is the most important. But the truth is, without all three feeding each other, truly effective insight is almost impossible to attain.


WANT TO KNOW MORE?

Our team of digital consultants have helped many organisations from John Lewis to Heathrow Airport, if you need help with you digital marketing strategy, get in touch.

Who are Londoners and how do they shop?

In this Article

Greater London is just over 40 miles wide yet has a larger population than Scotland & Wales combined. The capital makes up 13% of all retail spend in the UK and has a significant overrepresentation of the country’s most affluent urban demographic groups.

People often talk about London being its own bubble, and Londoners’ behaviour certainly reflects that. London consumer behaviour is unique and reflects the extensive supply of retail, catering and leisure compared to anywhere else in the UK.

CACI research sheds some light on just how different the London consumer is, both demographically and behaviourally, compared to the rest of the UK.

Polarised London

London’s demographic profile is the most polarised in the UK; there are more of the country’s most affluent demographic groups, as well as the younger affluent groups, but there are also high volumes of the least affluent members of the country.

What is Acorn?

The younger and affluent consumer groups have the most significant impact on London shopping locations. They are in abundance, they have money to spend, they are brand conscious and they are constantly seeking experience. It is the way these shoppers interact with a centre which ultimately shapes the London retail and catering landscape.

To help quantify the scale of wealth of some of London’s key Acorn groups, CACI compared house prices and income in London to their counterparts elsewhere in the UK.

For example, Lavish Lifestyles have an average house value of £3.8m with savings and investments in excess of £100k. City Sophisticates, the most prevalent group in London, live in houses valued at £1.5m on average and incomes 56% higher than the UK average.

At the other end of the scale Struggling Estates feel the brunt of London house prices, more likely to be renting accommodation with a not-so-modest value of £426k, paired with an average income -22% lower than the UK average.

The Promiscuous Shopper

London shoppers have a higher frequency of visit compared to the UK average. This is a function of the nation’s capital having everything on their doorstep which means that they can be promiscuous in where they choose to shop. For example, in a week it is possible to pick up some jeans in Shoreditch, collect groceries on the way home to Brixton and stop by Oxford Street the next day to get a top to match the jeans from yesterday.

This is why average retail spend per trip sits marginally lower in London than the rest of the UK (-6%), but when you consider their behaviour over the course of a year they are more valuable shoppers given the frequency in which they engage with retail. As ‘nownownow’ consumers they expect retailers to keep up with their needs and expectations.

A Culinary Scene

The most defining trend shaping Londoners’ consumer behaviour in the past year, is their propensity to spend on catering. Londoners’ average catering spend during Christmas peak season is 56% higher than elsewhere in the UK, despite their smaller party size.

This is partly attributed to the abundance of cash rich, time poor consumers (e.g. frequently grabbing some breakfast or lunch while on the go), but it is also a function of post-work time routine, where dining out and experiencing London’s ever-growing culinary scene is becoming an embedded part of London culture.

This is especially true amongst young, professional groups who dominate the London demographic and are key users of the evening economy. The older affluent groups, who tend to live on the outskirts of London, are less likely to engage with the post-work offer given they are more likely to be tied to catching trains home. As such, these groups are much more likely to be found utilising the ever-growing grab ‘n’ go culture during the day.

What This Means

London has been and will always be a driver of innovation across multiple sectors and channels. There is a need to adapt quickly and smartly to cater for an increasingly demanding consumer; recognising the differences and intricacies between the different demographic groups is key. Staying on top of this is challenging, but those who keep up with the pace will continue to reap the greatest rewards.

If you have any questions on how customer insight can help your business, please get in touch.