Reimagine data and AI Location intelligence Consumer spend data

Solutions

Consumer spend data

Vital insight into your markets

Use data-led insights from real spend data to better understand your markets.  Assess market share and spending patterns within the local catchment area of your brands and named competitors.  Study trends by demographics and channel.  Assess the impact of change, monitor market changes and spot where new opportunities lie. Make smarter decisions by having all the information needed to create successful strategies.  As it is coded with Acorn, we can adjust for bias in the data, ensuring it provides a true reflection of the market. 

Consumer spend data - Two people sitting at an outdoor cafe table, each holding a cup

Want to understand how you are really performing? 

Get a true picture of market share and how your performance compares to others. Quantify market sizes and demand. Spot the opportunities. 

Understand customers? 

Identify opportunity groups by understanding overall spend with different operators, transaction value and frequency by demographics and within local geographies. 

Need to measure the impact of change or channel interactions? 

Study the impact of retail activities and new site openings. Identify the best groups and retailers to target.  

Did you know?

25%

boost in local online sales following an update to Zara’s Liverpool ONE store.

Source: CACI

Where problems are solved 

Consumer spend data solutions that lead to better outcomes

Understand your performance

Understand exactly what is happening in your markets. See how your performance benchmarks against your competitors.  

Focus on the consumer

Build profiles of your customers and those of key competitors. Get a clear picture of consumer behaviour using our customer level data. 

Find headroom 

Size markets and see where you can grow your share. Identify areas and consumer groups to target where your competitors perform well

Stay current 

Have the latest information at your fingertips. Get regular updates on market changes in a customised feed.  

Think locally

Define and understand specific catchment areas around your stores. Use the data for marketing, and decisions around store activities and openings.   

Measure impacts

Whether that is your online halo or the effect of competitors openings or in-store changes, measure effects on share, spend, ATV and demographic profiles. 

Testimonial

The CACI Consumer Spend Data has been instrumental in Sainsbury’s breaking new ground in our understanding of the evolution of multi-channel grocery. With it we can now observe changes in consumer spending and preference across channels at both national and local level and can see market dynamics play out in near real-time.

Sainsbury’s

We bring our expertise to you 

Why leading organisations use our consumer spend data solutions

Track competitors 

You can choose which competitors you want to track and get all the data you need on them. 

Combine insights 

You can combine with other sources of insight, such as mobility data and surveys that are also coded with Acorn. 

Geographical granularity 

You can get a comprehensive view of spend and market trends down to a local level. 

Awards & accreditations

Speak to an expert about consumer spend data solutions

We’re tried and trusted in this industry and have been involved in consumer data for decades. At CACI, we want to support you in transforming your business.
  
If you’re looking for a demo, want to book a consultation, or both – we’re ready to help you cut the complexity out of consumer data. 

FAQs

Answers to common questions about consumer spend data. 

Yes, we do. The data is reweighted regionally by Acorn type to reduce bias and ensure that it reflects the population of Great Britain.  

The data can be provided at either post sector or LSOA level to provide local level insights. 

Consumer spend data is invaluable for identifying target areas for growth. By analysing spending patterns and market trends, businesses can pinpoint regions with high potential for expansion. This data helps quantify market sizes and demand, allowing businesses to focus their efforts on areas where they can maximise their market share.

Solutions

Location planning 

Make informed location decisions 

Location planning gives you confidence in the investment decisions that you make about your networks of stores, cafes, restaurants, dealerships, distribution centres or any other physical outlets you operate.   

Data-led insights provide evidence-based evaluations of pipeline sites, identify ideal locations for new openings and quantify local, national and regional market potential for growing brands.  They also guide right-sizing strategies for brands looking to optimise their networks in light of changing market conditions. 

Location planning - People walking in a street

Need to forecast sales potential of new and existing sites? 

Accurately and objectively assess the true sales potential of any location. 

Need to assess the potential of your brand? 

Identify and quantify the optimum network of outlets required to maximise your profitable reach in any territory. 

Need to prioritise your network strategy? 

Prioritise openings and changes to existing networks using data-backed evidence. 

Where problems are solved 

Location planning designed to help you make profitable investment decisions

Data enhancement

Create richer data by blending your data with ours. Use analytics and visualisation tools to make informed decisions backed by evidence. 

Make forecasts 

Improve your sales predictions and impact forecasts using data and machine learning. Understand the impacts of your outlets on other channels to quantify the online halo resulting from your physical network. 

Analyse performance 

Understand what drives the performance of your existing estate. Assess current site performance against objective potential benchmarks. 

Decisions you can trust 

Gain focus and clarity with tailored, insight-rich reports, with firm recommendations. Make smarter strategic, operational and marketing decisions. 

Get the detail

Interrogate data and models in custom-made interactive tools. Get all the data and insights you need to succeed. 

Choose how you want it

Design how you want to manage and view the outputs. Self-serve from cloud-hosted GIS platforms and dashboards or attend our delivery workshops to disseminate our strategic recommendations. 

Testimonial

“At the end of this work, we had a growth plan to refer to, which meant we could prioritise and focus incoming opportunities. With tangible, data-led evidence and a well-defined process and criteria, we could make decisions more quickly and share the work of detailed site assessment around the team more easily.” 


Ross Lacey

Location Planning Manager, The Midcounties Co-operative

We bring our expertise to you  

Why leading organisations use our location planning solutions 

Quality data 

The outstanding range, depth and quality of the data underpinning our solutions. 

Purpose built 

Our solutions are always built with application in mind and customised to your specific needs. 

Expert knowledge 

Our large team has vast experience across a wide range of client and consultancy side engagements, delivering informed decisions. 

Awards & accreditations

Speak to one of our location planning experts

We’re tried and trusted in this industry and have been involved in location planning for decades. At CACI, we want to support you in transforming your business. 
 
If you’re looking for a demo, want to book a consultation, or both – we’re ready to help you cut the complexity out of location planning. 

FAQs

Answers to common questions about location planning. 

Location planning helps businesses maximise profitability by choosing optimal sites based on customer demographics, competition, and accessibility. It also improves operational efficiency, enhances customer satisfaction, and supports strategic growth by ensuring locations align with business goals.

Location planning helps businesses plan by understanding how consumers and places are changing. It ensures that stores, formats, ranges, and services are developed to meet future demands, making your business resilient to market changes.

Yes, location planning can accurately forecast sales potential by analysing demographic data, consumer behaviours, local competition, and market trends. For new sites, it predicts performance based on similar locations and market conditions. For existing sites, it identifies opportunities for improvement. This helps businesses make informed investment decisions and maximise profitability.

Solutions

Retail network optimisation

Right stores in the right places, right across the globe 

Property is expensive, shopping habits evolving and places are changing, making it ever more important to ensure you are investing in the right physical network. Understanding how many stores you should have and where, prioritising your expansion and being smart about formats, ranging and how your channels support each other are fundamental to driving a successful and profitable business.   

Retail Network Optimisation - Busy crowds of anonymous motion blurred shoppers on London street

Looking to expand? 

Target ideal locations and quantify how many stores or locations is optimal for you. 

Need to drive more profit from your network? 

Identify stores with headroom, measure online halo and understand missions and consumers to develop a multi-channel strategy. 

Want your estate to be fit for the future? 

Plan ahead by understanding how both consumers and places are changing. Develop and place stores, formats, ranges and services. 

Did you know? 

20%

more sales can be achieved by retailers through data-driven network optimisation.

Source: Hypertrade

65%

of retailers plan to offer same-day delivery within the next two years.

Source: Retail Drive

Where problems are solved 

Retail network optimisation solutions that deliver a profitable and strategic multi-channel network 

Invest wisely 

Ensure you invest in the right stores in the right places. Have confidence in your decisions by underpinning them with data and evidence. 

Size opportunities 

Quantify how large your estate could – or should – be to support conversations with investors. Assess the scale of opportunity for new formats, services and offerings, realising the potential financial benefit of investing in specific stores or locations.

Drive performance 

Identify underperforming stores and assess how to get more from them. Discover opportunities to streamline your retail network, optimising different channels and formats. 

Take a customer-centric approach 

Get to know your consumers to ensure you deliver stores that meet their needs. Offer the right ranges, balance convenience and brand engagement with an omnichannel experience. 

Quantify the value of online

Measure the interaction between online and in-store and how that varies. See the effect of different store locations on your online sales. 

Build long-term strategies

Harness a deep understanding of what drives success, customer change and how places are evolving to build future-proof strategies.  

Testimonial

“At the end of this work, we had a growth plan to refer to, which meant we could prioritise and focus incoming opportunities. With tangible, data-led evidence and a well-defined process and criteria, we could make decisions more quickly and share the work of detailed site assessment around the team more easily.” 

Ross Lacey

Location Planning Manager, The Midcounties Co-operative

We bring our expertise to you  

Why leading organisations use our retail network optimisation solutions 

De-risk your investment in property 

Underpin decisions with data and to ensure you are focusing where opportunity is greatest. 

Discover growth potential 

Use data-led insights to reveal how to drive sales from both new and existing locations. 

Test before you invest 

Explore, model and test scenarios before making investments. 

Awards & accreditations

Speak to one of our retail network experts

We’re tried and trusted in this industry and have been developing retail network strategies for decades. At CACI, we want to support you in transforming your business. 

FAQs

Answers to common questions about retail network optimisation. 

Retail network optimisation helps your business expand by targeting ideal locations and determining the optimal number of stores. This process involves analysing data to identify areas with high potential for success, ensuring you invest in the right places. By using data-driven insights, you can prioritise your expansion efforts, focusing on locations that offer the best opportunities for growth.

Retail network optimisation helps reduce costs by ensuring you invest in the right stores and locations. By analysing data to identify underperforming stores and opportunities for consolidation, businesses can streamline their operations and eliminate inefficiencies. This process also helps optimise store formats and product ranges, reducing overhead costs and improving overall profitability.

Retail network optimisation supports strategic decision-making by providing data-driven insights into market trends, consumer behaviours, and location performance. This information helps businesses make informed decisions about where to open new stores, how to allocate resources, and which markets to target. By aligning their retail network with strategic goals, businesses can enhance their competitive advantage and drive long-term growth.

Solutions

Geospatial analytics

Transforming your business with powerful geospatial analytics 

Harness the power of geospatial analytics to drive smarter decisions across your business.  Many analytics platforms have the capability to handle spatial data, but using spatial data effectively can be a challenge. CACI’s geospatial experts combine AI-powered insights, bespoke datasets and predictive algorithms to uncover customer behaviours and spatial patterns that will inform successful strategies.   

Geospatial analytics - Large two-story suburban houses with swimming pool in upscale residential neighborhood North of Dallas

ML and AI predictive modelling 

Employ the latest advancements in machine learning & GeoAI to elevate geospatial analytics to the next level.  

Granular and intelligent datasets 

We blend a wide range of sources combined with the latest techniques including deep learning and image analysis to create unique and purpose-built data. 

Transparent, actionable insights 

Best practice analytics do not become a black box. They explain gaps in performance and opportunities presented by the models, linking to clear, actionable recommendations. 

Where problems are solved 

What truly AI-powered geospatial analytics could mean for you 

Predict sales potential

Develop accurate predictive algorithms, blending unique data with the right techniques to create robust forecasts.  

Measure online and wholesale halo 

Develop accurate predictive algorithms, blending unique data with the right techniques to create robust forecasts.

Quantify demand 

Build on a detailed understanding of consumers to create detailed demand surfaces to understand the opportunity for new and existing products and services.

Measure impact

Quantify the impact of changes such as competitor openings, refits or expansions or addition of new offers and services.  Separate true impacts from market change or factors such as weather.  

Pinpoint target locations   

Identify ideal locations for your store locations down to street level. Factor in micro-level detail to identify where the footfall, supporting retail, micro-location drivers and more. 

Optimise your footprint  

Ensure your existing store network is configured to deliver maximum sales with minimal cannibalisation. Optimisation algorithms identify your ideal network configuration and underpin a realistic strategy to move from “as is” to ideal.  

Testimonial

The innovative approach with CACI was taking all that demographic data collected across Europe, tagging it with running surveys, and modelling it based on… geographic locations of different populations. That allowed us to come up with some numbers in those various locations, which was something we couldn’t find anywhere else. 

Johnathan Wharton

Portfolio Analytics Manager, Roche

We bring our expertise to you

Why leading organisations use our geospatial analytics services 

Expertise 

CACI’s models employ approaches such as ML-gravitational modelling, XGBoost and sophisticated geospatial algorithms to gain extra accuracy and confidence in key decision-making processes. 

Powerful, granular datasets 

We combine a granular understanding of people and customers through ML-powered geodemographic segmentations (e.g., Acorn, Ocean), where they go through granular mobility & movement data and what they spend via robust consumer spend datasets.  

Linking to business value 

We ensure that any application of geospatial analytics connects your business functions and goals with realised value. Our services are designed to be tailored to your business needs and to maximise value across teams and business functions. 

Awards & accreditations

Speak to one of our geospatial analytics experts

We’ve led the geospatial analytics industry for decades with unsurpassed trust in our experience and techniques. At CACI, we want to support you in transforming your business.
  
If you’re looking for a demo, want to book a consultation, or both – we’re ready to help you cut the complexity out of geospatial analytics. 

FAQs

Answers to common questions about geospatial analytics.

Geospatial analytics enhances decision-making, improves efficiency, optimises resource management, provides a competitive edge by identifying market trends, and integrates seamlessly with GIS, ERP, and CRM systems for comprehensive data analysis.

Key features of geospatial analytics include data visualisation, spatial analysis, mapping, geocoding, and integration with other data sources. These features enable businesses to analyse geographic data, create detailed maps, and gain insights into spatial relationships and patterns.

An example of applying geospatial analytics is analysing traffic patterns in a city to optimise public transportation routes. By combining GPS data from buses, traffic sensors, and demographic information, city planners can identify congested areas and adjust routes to improve efficiency and reduce travel time.

Solutions

Location intelligence

Advanced analytics to forecast, plan and optimise performance 

We deliver pioneering market intelligence through advanced location analytics, performance forecasting and network planning solutions. Our expertise empowers businesses to make smarter, data-backed commercial decisions.

Location intelligence -Women standing on a city street at night, with blurred lights and buildings in the background.

Why CACI?

Optimise market strategy 

Our expertise and proprietary data solutions give businesses the intelligence needed to make informed decisions. 

Unrivalled forecasting 

Our predictive models help clients anticipate trends, forecast sales and improve performance planning. 

Flexible and scalable 

Our tools seamlessly integrate with business operations, ensuring adaptability and long-term commercial success. 

Did you know?

23%

Only 23% of organisations use location analytics capabilities within their own business intelligence platforms

40%

Companies leveraging predictive analytics have reduced product inventories by up to 40% by optimising demand across different regions

Speak to one of our location intelligence experts

We’re tried and trusted in this industry and have been involved in location intelligence for decades.
  
If you’re looking for a demo, want to book a consultation, or both – we’re ready to help you cut the complexity out of location intelligence. 

Which Klepierre retail centres in France would benefit the most from Gymshark?

In this Article

In our previous blog in this two-part series, we uncovered why France would be a good option for a Gymshark European market expansion and key considerations the brand could take for a successful expansion. Today, we’ll assess which Klepierre retail centres in these high-potential French cities would benefit most from housing a Gymshark in their centre as part of a hypothetical Gymshark French market expansion.

How Retail Footprint Europe could help Klepierre understand which retail centres would benefit from a Gymshark store

While there are many centres in France that would be suitable to bring Gymshark into based on the best shopper profile correlation in a hypothetical Gymshark market expansion, Retail Footprint Europe, CACI’s machine learning catchment model defining catchments for thousands of destinations, has helped determine three particular Klepierre centres that would ultimately become a good fit. With key Gymshark shoppers comprising Affluent Singles & Couples, Affluent Young Families, Middle Income Singles and Student Life profiles from Acorn, CACI’s geodemographic segmentation, these insights were cross-referenced against Retail Footprint Europe insights to equip the business with granular insights and tangible actions to help landlords deduce which centres would work and why.

Finally, to gain insight into actual footfall and compare actual versus expected footfall against these Gymshark profiles and conclude which centres presented opportunities to attract more of Gymshark’s core shoppers, Mobility Data was leveraged.

Saint-Lazare Klepierre in Paris

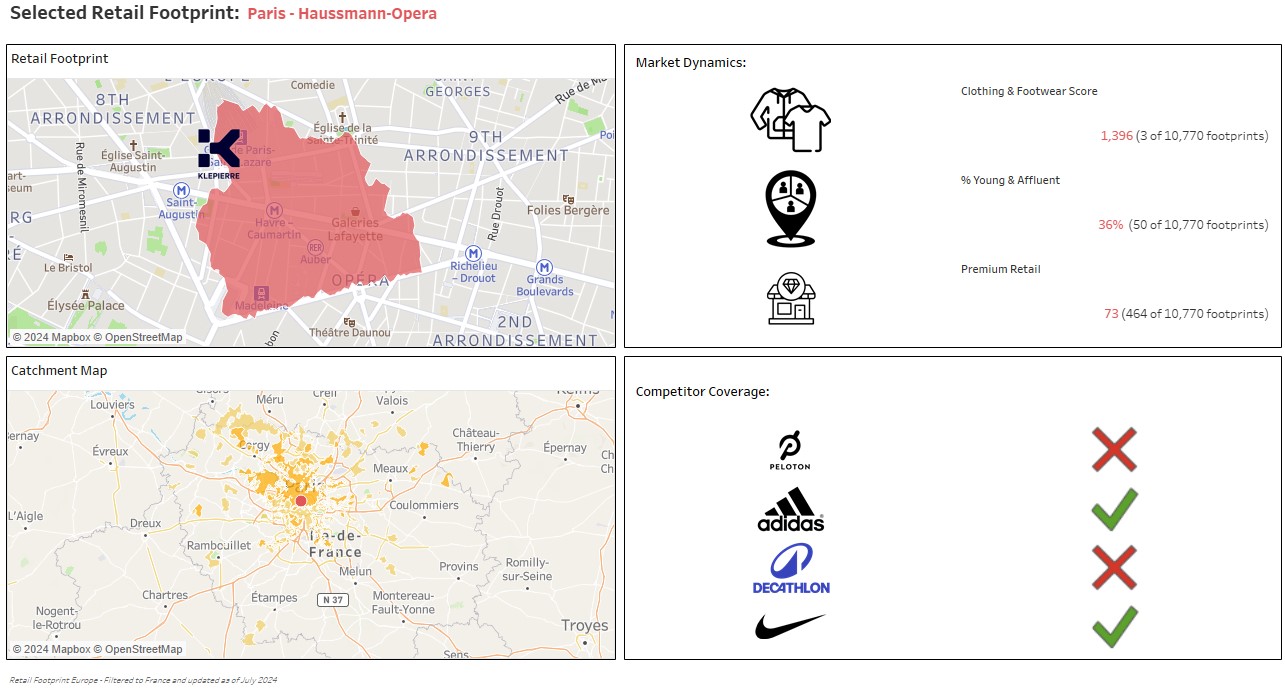
According to our findings, one of the Klepierre centres that would benefit most from the presence of a Gymshark would be the Saint-Lazare in the Haussmann-Opera retail area. This centre is expected to attract the highest potential of Gymshark’s core shoppers at 43%. Saint-Lazare also has the most affluent profile at an expected 34%. However, the area is home to lower levels of Student Life profiles, with just 1% expected to visit the centre.

Paris houses a strong proportion of premium retailers that align with Gymshark’s offering, with this particular Klepierre centre featuring a blend of competitors and complementary retailers, already housing the likes of Adidas and Nike, which both have similar offerings to Gymshark. Its shopper demographic also lends itself to those who are likely to either be existing Gymshark customers or will become ones once the brand enters the physical market.

Retail Footprint Europe insights for Saint-Lazare Klepierre

The Haussman-Opera retail area holds the third largest clothing and footwear store presence across France, with many premium and broader retailers and a higher percentage of affluent and younger consumers. Our findings also show that people travel well outside of Paris into this area to shop, making it a fantastic location to quickly grow brand reach and exposure.

Acorn insights for Saint-Lazare Klepierre

Saint-Lazare appears to perform the most in line with Gymshark’s core shoppers, with 44% originating from its expected profile according to our Mobility Data findings. This data provides insight on actual footfall and illustrates the comparison between actual and expected versus the Gymshark profile to understand if a centre had an opportunity to attract more of Gymshark’s core shoppers.

As a more premium brand, Gymshark achieves particularly high indexes for affluent consumers, but also performs well with aspiring, younger and urban consumers within the Gymshark core shopper profiles outlined by Acorn. Compared to fellow sportswear brand, Adidas, the brand has a much broader appeal and can perform in-line with their average consumers, while Gymshark performs significantly weaker in these segments.

Centre Commercial Centre Bourse Klepierre in Marseille

Retail Footprint Europe insights for Centre Commercial Centre Bourse Klepierre

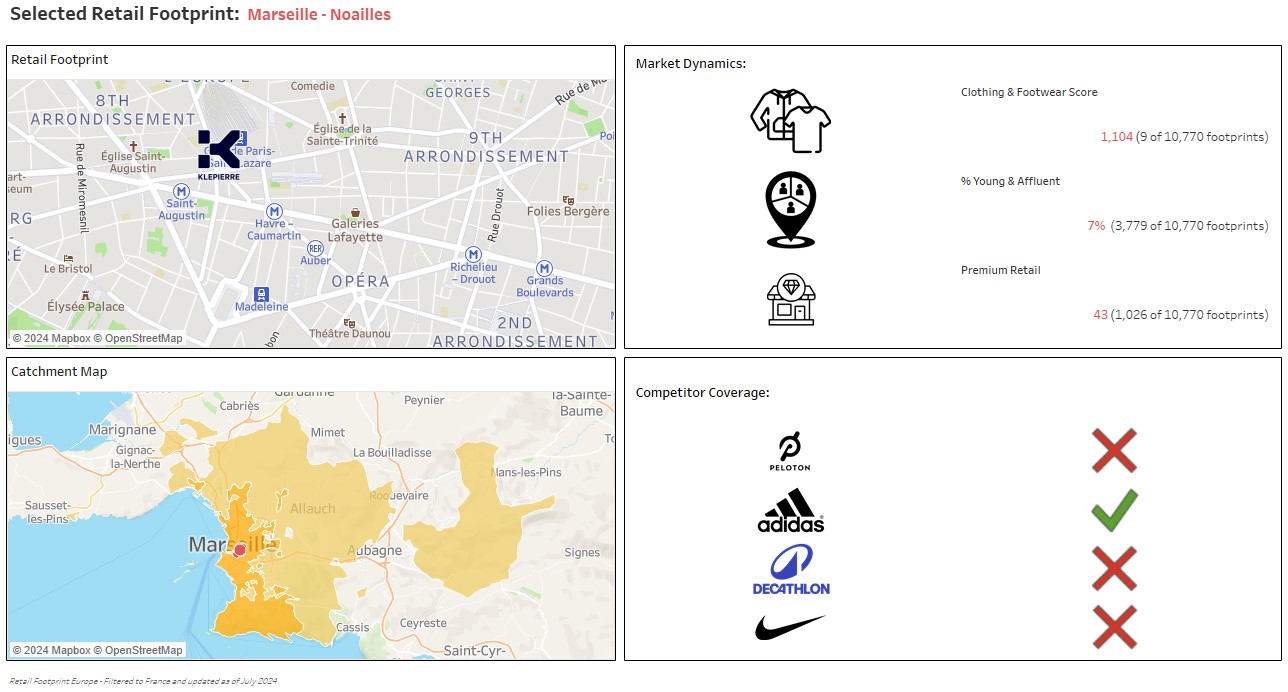
Centre Commercial Centre Bourse would be a strong runner up to Paris thanks to its high-performing site in terms of its Clothing and Footwear Score and its high proportion of premium retailers that align with Gymshark’s offering, according to our Retail Footprint Europe findings. However, this centre has a rather low proportion of a young and affluent shopper demographic compared to Saint-Lazare in Paris, which could see the brand running the risk of not attracting the right shoppers upon opening.

Acorn insights for Centre Commercial Centre Bourse Klepierre

Another defining factor behind Centre Commercial Centre Bourse being a suitable location for a French market expansion is due to the city’s likelihood of having the highest proportion of Affluent Young Families (15%) compared to the other locations. According to Acorn, Centre Commercial Centre Bourse in particular attracts 36% of Gymshark’s core shoppers.

Mobility Data insights for Centre Commercial Centre Bourse Klepierre

Marseille sees a 14pp higher proportion of footfall from Gymshark’s shoppers than expected, driven by the centre attracting significantly more Affluent Singles and Couples than expected, according to Mobility Data findings. Centre Commercial Centre Bourse highly reflects Gymshark’s core shoppers (both in expected and actual footfall) and has strong proportions across the different core shopper groups, while Paris is much more concentrated on a singular Affluent group.

This centre ranks 9th out of over 10,000 retail centres for its Clothing & Footwear Score and has a strong premium retail score, even higher than that of Paris. Marseille also only has one competitor in its centre, meaning the addition of another sportswear brand wouldn’t saturate the market, but shows there is demand for this category in the area.

Les Passages Pasteur Klepierre in Besancon

Retail Footprint Europe insights for Les Passages Pasteur Klepierre

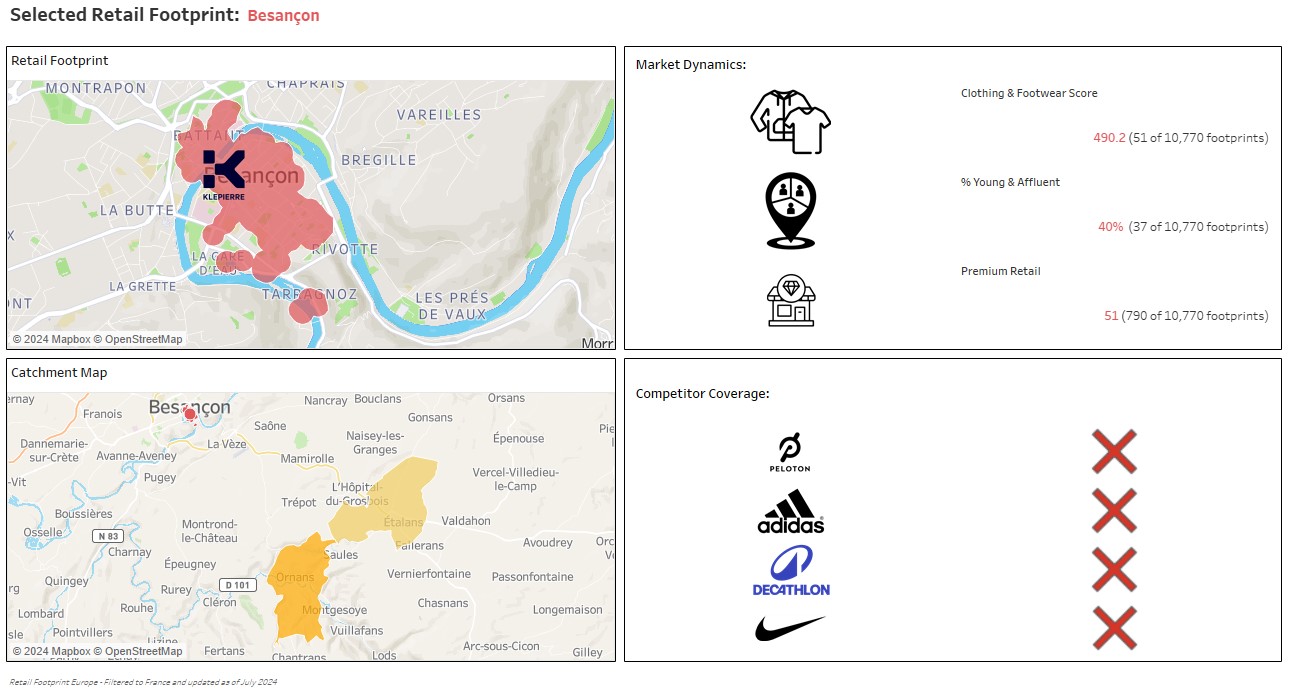
Surprisingly, despite this smaller size of this city and inevitably lesser likelihood of Gymshark opening here, it is actually home to a high level of one of Gymshark’s core shopper demographics, Student Life, as seen in our Retail Footprint Europe data. As with Centre Commercial Centre Bourse in Marseilles, Les Passages Pasteur has a strong Clothing and Footwear offering, a substantial percentage of which are classed as premium retail. While Besancon doesn’t have any direct competitor or complimentary brands, this could be navigated with the help of clever marketing strategies.

Acorn insights for Les Passages Pasteur Klepierre

Les Passages Pasteur has a much younger profile that comprises 31% of Gymshark’s core shoppers, with 12% of its catchment expected to be Student Life, based on findings from Acorn. Unlike Centre Commercial Centre Bourse, Les Passages Pasteur has a high percentage of young and affluent shoppers (even higher than Paris), which would ensure that Gymshark was opening to a shopper demographic most likely to shop with the brand. However, the city has the least affluent profile out of the three.

Mobility Data insights for Les Passages Pasteur Klepierre

Les Passages Pasteur appears to attract the most significant amount of Gymshark’s shoppers in real footfall, with 53% of its actual footfall being from Gymshark core shoppers, as seen in our Mobility Data findings. This is because the centre is significantly over-achieving in attracting Student Life (+21pp versus expectation), showing the centre resonates very well with younger shoppers.

Using the data, which Klepierre centre would best perform in France?

With the aforementioned data to consider, the strongest contender for a successful French market expansion for Gymshark would likely come from Centre Commercial Centre Bourse Klepierre. This is due to its strong representation of Gymshark’s core shoppers, both in expected and actual footfall, as well as the proportions across the different core shopper groups compared to the other two cities and centres being more concentrated on a singular group (e.g. Affluent groups in Paris and Student Life in Besancon). With only one competitor in the Centre Commercial Centre Bourse Klepierre, the addition of another sportswear brand won’t oversaturate the market. Instead, it’d reiterate the demand for this category in the area.

Ready to Find Your Next Market?

With insights from Retail Footprint Europe, pinpoint the best locations for your brand’s growth across Europe.

Why France would best suit a Gymshark European market expansion

In this Article

A new sportswear retailer emerges on the international stage.

Gymshark, a fast-growing activewear brand, has been rapidly expanding its global reach and brand presence as it ventures into the world of brick and mortar. Having recently opened new stores in the UK (Stratford City), the Middle East (Dubai) and a pop-up concept in New York City, this brand with a prominent social media and predominately online presence is now rapidly infiltrating physical retail.

Despite not yet launching across wider Europe, it’s only a matter of time before these markets will be ventured into via physical pop-ups and stores. Selecting the right locations out of countless options may be a daunting task that comes with the territory, however. So, once the time comes for Gymshark to decide which locations to expand into that will maximise their increasing growing brand recognition and ROI, how should they effectively go about it?

In this two-part blog series, we’ll walk you through a hypothetical European market expansion for Gymshark in France, sharing how the brand can use data to accelerate and enhance their international store network strategies.

Three French cities that demonstrate viable market expansion potential based on insights taken from CACI datasets and segmentation tools will be focused on, as well as key takeaways that Gymshark (or brands in a similar position) could consider when it comes to international market expansion.

How France was identified as an optimal location for a Gymshark European expansion

CACI possesses a complete universe of defined retail areas to consider, a detailed understanding of different types of consumers and where they shop. This enables us to guide a brand like Gymshark to maximise success and value from go-to-market strategy and launch through to expanding into broader brand recognition and market share capture.

With this in mind, and with Gymshark expanding into physical and new regions, we investigated European markets that might fit their need should they decide to expand into Europe.

With Gymshark already a brand on CACI’s Brand Dimensions, a dataset tracking hundreds of the UK’s most popular and emerging brands to reveal spend, sales and average transaction value insights, key groups in French Acorn could also be identified.

Key Acorn groups were identified by using Brand Dimensions data followed by selecting key Acorn groups within French Acorn data, which correlated accordingly. In France alone there are over 10,000 retail areas, each with differing levels of existing premium clothing shops and competitors, types of customers, footfall, population and spend.

By comparing this to the expected view from Retail Footprint Europe, we could identify locations that were currently failing to engage Gymshark’s key shoppers but had the opportunity to.

From these collective findings, we were able to conclude the following three French locations that could benefit from the opening of Gymshark: Paris, Marseille and Besancon.

Why Paris would perform well in a Gymshark France expansion

According to our findings, Paris presents the highest performance potential and should be a primary focus for Gymshark. Aside from being the biggest city in France -an obvious bonus for any brand – Paris presents the best shopper demographic, a strong array of existing premium retailers and the ability to attract the relevant demographic groups that would align to Gymshark’s brand identity of being a premium retailer with similar retailers already in the centre.

Retail Footprint Europe enables the use of transactional data across brands to develop an understanding of the typical Gymshark shopper, brand positioning and establishing criteria for the most suitable locations for Gymshark to consider regarding new store openings.

Considering these criteria, Paris ranked incredibly high on Clothing and Footwear, with the Haussmann-Opera retail area Klepierre centre ranking among the top three across France.

Why Marseille would perform well in a Gymshark France expansion

Marseille presents itself as another viable option as our findings show it to be the middle ground between high affluence profiles and younger, ‘student life’ populations found in other larger, prominent French cities. The city’s strong clothing and footwear and high proportion of premium retailers also contributes to its performance potential. However, its lower ‘young and affluent’ target demographic runs a potential risk.

Why Besancon would perform well in a Gymshark France expansion

Despite Besancon presenting itself as more of a curveball, the granularity of our Retail Footprint findings demonstrate that in spite of its smaller size and lesser known location, the city is home to a strong clothing and retail offering including premium retailers, a high percentage of young and affluent shoppers and is overall more likely to attract the right shoppers.

Key takeaways that Gymshark can consider for a French market expansion

These aforementioned insights would enable Gymshark to better understand their long-term audience capture of sites through physical retail and experiment with different formats and experiential offerings.

Combining Retail Footprint data across Europe with demographic, transactional, brand alignment and footfall data can ultimately be used to shape an evolving store network strategy, and the national view further solidifies an understanding of the entire retail landscape of France.

Through these insights, Gymshark would be able to accelerate store openings with greater confidence and success if or when they decide to expand into Europe.

Ready to Find Your Next Market?

With insights from Retail Footprint Europe, pinpoint the best locations for your brand’s growth across Europe.

Stay tuned for next blog in this two-part series, where we’ll assess which Klepierre centres in these high-performing potential French cities could perform well in a Gymshark French market expansion.

Challenging areas for the grey belt: London and the South West

In this Article

In this final article in our grey belt series combining CACI’s housing demand data with VirginLand’s grey belt site identification, we take a deeper dive into two areas where the impact of the grey belt will be less obvious: London and the South West.

This is not to diminish the overall value of the initiative, but to point out that it is not the single answer to the UK’s housing challenges. To be most effective, grey belt reallocation should be considered alongside other mechanisms to accelerate housing delivery such as brownfield, infill, repurposing and urban regeneration.

How will the grey belt initiative affect London?

Home to over 7 million adults, London is by far the most densely populated region in the UK. As a result, demand for housing is particularly acute in the capital and the conversation is dominated by affordability. It’s easy to see why; house prices are 11 times the average household income, and private rent is 37% of income. Although households in London earn 17% more than the national average, these high prices mean that homes are 59% less affordable to buy and 32% less affordable to rent.

Chart showing that London house prices outweigh elevated incomes using CACI datasets

In this context, any initiative to increase the overall supply of housing in this region is welcome; particularly if it’s targeted at the more affordable end of the scale. So, what impact will the grey belt have in London?

Although home to 14% of the population, London can house just 0.4% of all grey belt homes – a total of 1,955 dwellings across 31 sites. This is not for want of green belt (22% of the London region, by area, is currently designated as green belt), but for want of suitable locations that could be re-designated.

Analysis by VirginLand shows that just 0.2% of the available green belt land is likely to be reallocated grey belt, with much of the London’s green belt holding additional designations like Designated Open Space, Country Park, Woodland or Nature Reserve and Conservation Area and Grade 1-3b agricultural land grades.

The challenge in London is also compounded by the location of the sites relative to movers. Being on the outskirts of the urban sprawl, just 11% of all London home movers live within the catchment of the identified sites; roughly 192,000 individuals. Although more than enough to absorb any new homes delivered, the scale of movers puts into perspective how limited the impact would be on demand; if all sites were built out to their fullest, there would be 98 movers for each home.

While there is little doubt that the 31 identified locations would be additive to the overall housing stock, the question is over how much of an impact these limited sites can have on a particularly strained market. With the population set to grow by another 6.1% in the next 10 years, London will need other initiatives, alongside the grey belt, to accelerate housing delivery in more urban neighbourhoods.

How will the grey belt initiative affect the South West?

Just 4.5% of the South West is designated as green belt, well below the national average. It therefore follows that grey belt opportunities in the South West will be similarly limited, and just 228 potential sites have been identified with the combined potential to deliver 11,868 new homes.

While this is not an insignificant number of homes, it represents just 2.2% of the total grey belt opportunity spread across 9.4% of the population. The location of grey belt sites also limits the initiative’s regional impact, as just 18% of the 1.6 million potential South West movers live within the grey belt catchment, against a national average of 36%.

Although limited in scope for the region as a whole, there are some pockets where the grey belt will be more impactful, and the characteristics of the catchment movers in these locations point to the type of homes that should be prioritised.

With concentrations of sites close to urban populations in the likes of Bristol, house-to-earning ratios and rent-to-earning within the grey belt catchment are higher than those outside of it (7.1 times income and 27.4% of income respectively). High concentrations of Family Renters, Tenant Living and Cash-Strapped Families within this catchment, and relatively large sites averaging 1.7 hectares, suggest a particular opportunity to deliver larger mixed neighbourhoods with high levels of rental product.

As with London, the grey belt initiative has the potential to support some of the housing needs of the South West, but an overarching housing strategy for the region should also be mindful of the 82% of home movers that live outside of the grey belt catchment.

How CACI can help?

To learn more about how you can ensure that your developments are meeting the demands of local movers, contact CACI.

Missed the previous blogs? Find the links to the series so far below:

Grey belt sites: what they are, locations & impact on housing

In this Article

In the previous blog within this series, CACI assessed the current state of the UK’s house building targets and how grey belt sites can lead to improved outcomes. Today, Virgin Land will dive deeper into what these grey belt sites are, including their locations and projected impact on the future of housing.  

Grey belt sites explained: freeing land for homes

The UK’s ongoing housing crisis has left politicians and planners scrambling for solutions. To address the shortfall, the new Labour government has introduced a fresh approach: grey belt sites. But what exactly does this mean, and how might it help? 

“Grey belt” refers to parts of the green belt that the government believes can be reclassified for development. These areas, while part of the green belt, make limited contributions to the five core purposes of the green belt, like safeguarding the countryside or stopping towns from merging together.

Since they no longer offer much in the way of environmental or spatial benefits, they could now be considered for development under new rules. The grey belt typically consists of previously developed land or parcels with minimal environmental or historical significance.

By shifting these areas from green belt protection to grey belt status, the government hopes to balance the need for housing with environmental sustainability. In practice, grey belt sites include land that may have been industrially or commercially used in the past, or areas close to urban centres that are no longer agriculturally productive.

These sites provide a critical opportunity to deliver housing where it’s most needed, particularly in regions where development has stagnated due to green belt restrictions. 

How many grey belt sites exist & where are they located?

At Virgin Land, we’ve conducted an extensive study and found around 14,000 possible Grey Belt sites across England and Scotland, covering about 17,500 hectares. That’s just over 1% of all Green Belt land in the country, underscoring the selective nature of this reclassification.

Most Grey Belt land can be found in older industrial towns, particularly in the Northwest and Midlands, where a whopping 64% of people in the Northwest live within two miles of a potential site (the national average is 38%). In future blog posts, we’ll take a closer look at the regions across the UK.

How could grey belt sites impact housing?

Reclassifying land as Grey Belt opens up a significant opportunity for housing development, especially in regions where supply has consistently failed to meet demand.

Based on current estimates, if development were to proceed at an average density of 30 dwellings per hectare, the identified Grey Belt sites could accommodate around 525,000 new homes. If densities were to increase to 35 or 40 dwellings per hectare, the number could rise to 610,000 or even 700,000 homes. But even with this potential, the government still wants to focus on brownfield first approach before using any Grey Belt land.

Local Planning Authorities (LPAs) are required to prioritise brownfield sites before considering greenfield or grey belt areas for development.

Future predictions of housing through grey belt sites

The grey belt idea is a big shift in how we think about land use, potentially opening up vast amounts of space for new housing. It’s especially promising for regions like the Northwest and Midlands, where building has been difficult in the past due to green belt restrictions.

However, this isn’t a magic fix—some areas like London and the Southeast still face substantial challenges when it comes to housing. Making the most of grey belt land will take careful planning and input from the public to ensure that the right balance is struck. This new approach could help ease the housing crisis, but only if it’s rolled out thoughtfully. 

How Virgin Land and CACI help?

To find out more about ensuring your developments meet the demands of local movers, contact CACI and they will be touch.

* This insightful blog has been authored by Steve Norman and Sam Bedford from Virgin Land.

Understanding the meaning of geographic coverage across a business

In this Article

 When it comes to purchasing geospatial data for organisations in the Logistics sector, ensuring that you and your business have asked the right questions to secure accurate data will be key to the success of your planning, efficiency and optimisation initiatives. Our new blog series will answer the critical questions you should ask yourself when acquiring geospatial data for yourself or your organisation, from its coverage, accessibility and accuracy to legal sharing and usage.  

What is the meaning of geographic coverage?

Geographic coverage is where the boundaries of the data extend to. For every piece of information that your business acquires, you must define the geographic coverage that you need it for. Without defining the boundary of the data, you could end up with far more data than you need. If you don’t define the geographic coverage, you may not receive all the data that you need. It’s important that you clearly define the geographic coverage for your data requirement.

What elements of geographic coverage through data should you consider before starting your project?

You should consider the geographic coverage that you need at the outset of your project and assess any future needs across multiple countries. Here are some example questions that may help you to ensure your geographic data requirements will be covered: 

  • What is the difference between the United Kingdom and Great Britain? 
  • If I buy data now for a specific country (e.g. The Netherlands), will it be available at the same detail in another country (e.g. Belgium)? 
  • Will the maps and road networks line up across the borders? 
  • Does the data cover the small islands around the edges of a country or small neighbouring countries such as Monaco? 
  • Which countries offer detailed street level data in major towns and cities vs key roads in urban areas?

Stay tuned for our next post, where we’ll dive into geospatial data analysis and the attribute information that comes with it. 

Our team of experts can help you navigate the intricacies of every dataset in every country across the globe. Download our whitepaper ‘Key questions to ask when buying geospatial data’ to find out more.