How will the grey belt initiative affect North West England & Scotland?

How will the grey belt initiative affect North West England & Scotland?

In our previous blog in this series, we assessed the impact of the grey belt initiative on housing nationally. In this blog, we turn our attention to two regions: North West England and Scotland, assessing the potential impact of the grey belt initiative on both regions.

How will the grey belt initiative affect North West England?

The North West represents one of the biggest opportunities for the grey belt, where 69,820 new homes could be delivered across the 951 potential grey belt locations identified by VirginLand. While the North West is not, in fact, the region with the largest number of individual sites (Scotland has 5,960 sites and South East England has 3,207 identified locations), it is home to the largest sites, with each location able to accommodate 73 units on average across 2.4 hectares.

What makes the grey belt a good bet for the North West is not just the number and size of sites identified, but their location relative to potential movers. In fact, 58% of all home movers in the North West live within the grey belt catchment, comprising over 1 million movers.

Using CACI’s Paycheck and StreetValue datasets, the affordability levels within the catchment of the grey belt sites can be assessed to better understand the regional role that the grey belt can play. At five times the average household income, house-price-to-earning ratios within the catchment area of the grey belt are in line with the North West average (5.1 times income) and below the national average of 6.8 times income. At the same time, private rents sit at just 18.3% of the average earnings, against a regional backdrop of 21.1% and national averages of 27.6% of earnings. The requirements of the grey belt in the North West are not necessarily to deliver dramatically more affordable housing than is already available in the area, but to increase the overall supply of housing.

How will the grey belt initiative affect Scotland?

As with the North West, the grey belt is well located to serve the needs of many home movers in Scotland, with 54% of all movers living within easy reach of the 5,960 sites identified by VirginLand. Although numerous, the sites in Scotland are the smallest of any region, averaging at just 0.4 hectares that could accommodate 12 new dwellings.

Unlike the North West, there is a clear set of characteristics among catchment movers that provide clear guidance on the type of housing that is needed of Scotland’s grey belt. Of the 665,000 potential catchment movers, 44% are expected to move to flats (against a national average of 18%) and 28% to move to social rented accommodation (against a national average of 19%). CACI’s geodemographic segmentation of the UK, Acorn, provides further clarity, with high concentrations of people moving to “Hard Up Household”, “Cash Strapped Family”, “Constrained Pensioner” and “Challenged Circumstances” neighbourhoods.
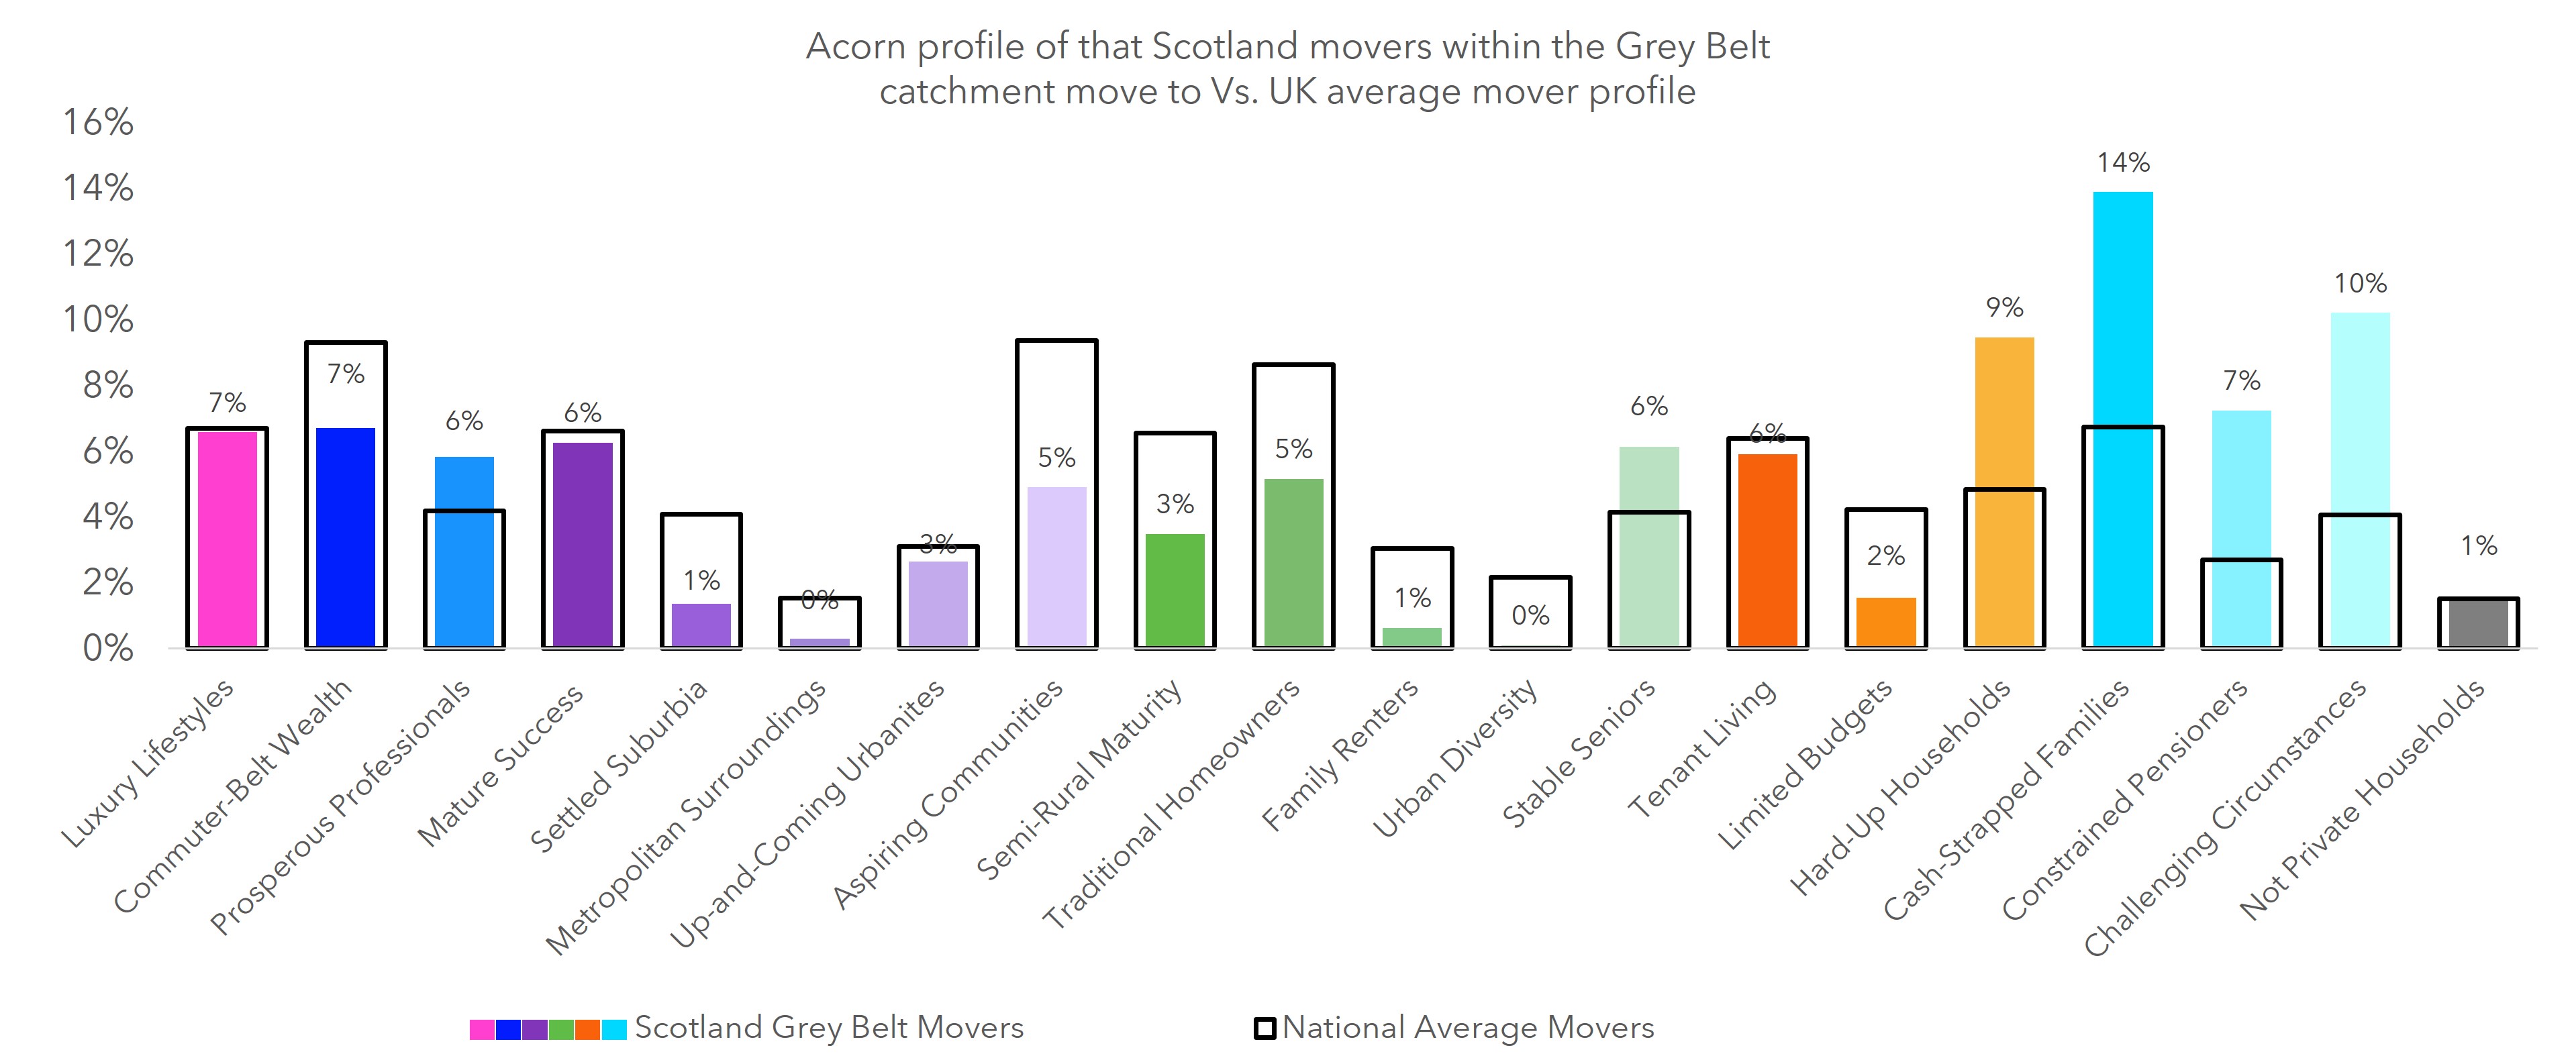
These demographic groups are some of the most economically strained within our society, and audiences that we have demonstrated in previous articles have had relatively little new housing delivery in recent years. On a practical sense, it has proved hard for private enterprise to make truly affordable new housing projects for these groups commercially viable because of the prices that they can afford to pay relative to project costs. However, this is a challenge that will need to be overcome to unlock the full potential of the grey belt in Scotland, either through closer collaboration or the delivery of blended neighbourhoods.

What conclusions can be drawn from these two regions and applies to the grey belt initiative on a national scale?

Contained within these two regions are the following important conclusions that can be applied to the national picture:

  1. The grey belt does indeed represent a significant opportunity to accelerate housing delivery in areas that need it.
  2. Effective delivery of housing within the grey belt will come from a place of understanding and designing for the intended audience from the outset.

How CACI can help?

To learn more about how you can ensure that your developments are meeting the demands of local movers, contact CACI.

Missed the previous blogs? Find the links to the series so far below:

How grey belt sites will help tackle the UK housing crisis

Grey belt sites: what they are, locations & impact on housing

Assessing the impact of the grey belt initiative on a National scale

Assessing the impact of the grey belt initiative on a National scale
Assessing the impact of the grey belt initiative on a National scale
 

In our previous blog in this series, we dove into what grey belt sites are, including their locations and projected impact on the future of housing. Today, we’ll examine the grey belt strategy on a national scale.

How can the grey belt initiative impact housing on a national scale?

As previously highlighted, the government aims to build 1.5 million homes in the next five years. If successfully implemented, the grey belt initiative could play a pivotal role in meeting this ambitious target. The former government set significant housebuilding goals—constructing 300,000 homes annually and achieving 1 million new homes over a parliamentary term. However, the figures for 2021-22 and 2022-23 fell short, with only around 235,000 homes built each year. With the new Labour government adopting even more aggressive targets, innovative strategies like repurposing grey belt land could be key to delivering homes on a larger scale.

VirginLand research has uncovered nearly 8,000 potential grey belt sites across England and a further 6,000 in Scotland. The 7,823 sites in England could collectively accommodate up to 450,000 new homes, while the 5,960 in Scotland could accommodate 74,000. With a total capacity of 524,000 new homes, the grey belt represents a substantial opportunity to address the housing shortage. In partnership, CACI has revealed that 36% of all home movers in these regions live within two miles of a potential grey belt site. To put this into perspective, nearly 5 million potential home movers are currently situated within the catchment areas of these sites. This emphasises the strategic importance of grey belt land, not only in providing housing, but in meeting demand where people are already seeking to relocate.

The fact that one in three movers live so close to these sites is a powerful indicator of the relevance of grey belt land in addressing the housing needs of a growing, mobile population. This proximity strengthens the case for rolling out the grey belt strategy on a national level, offering immediate and long-term benefits to communities in need of affordable housing solutions.

How undeserved & undersupplied groups will be supported by the grey belt initiative

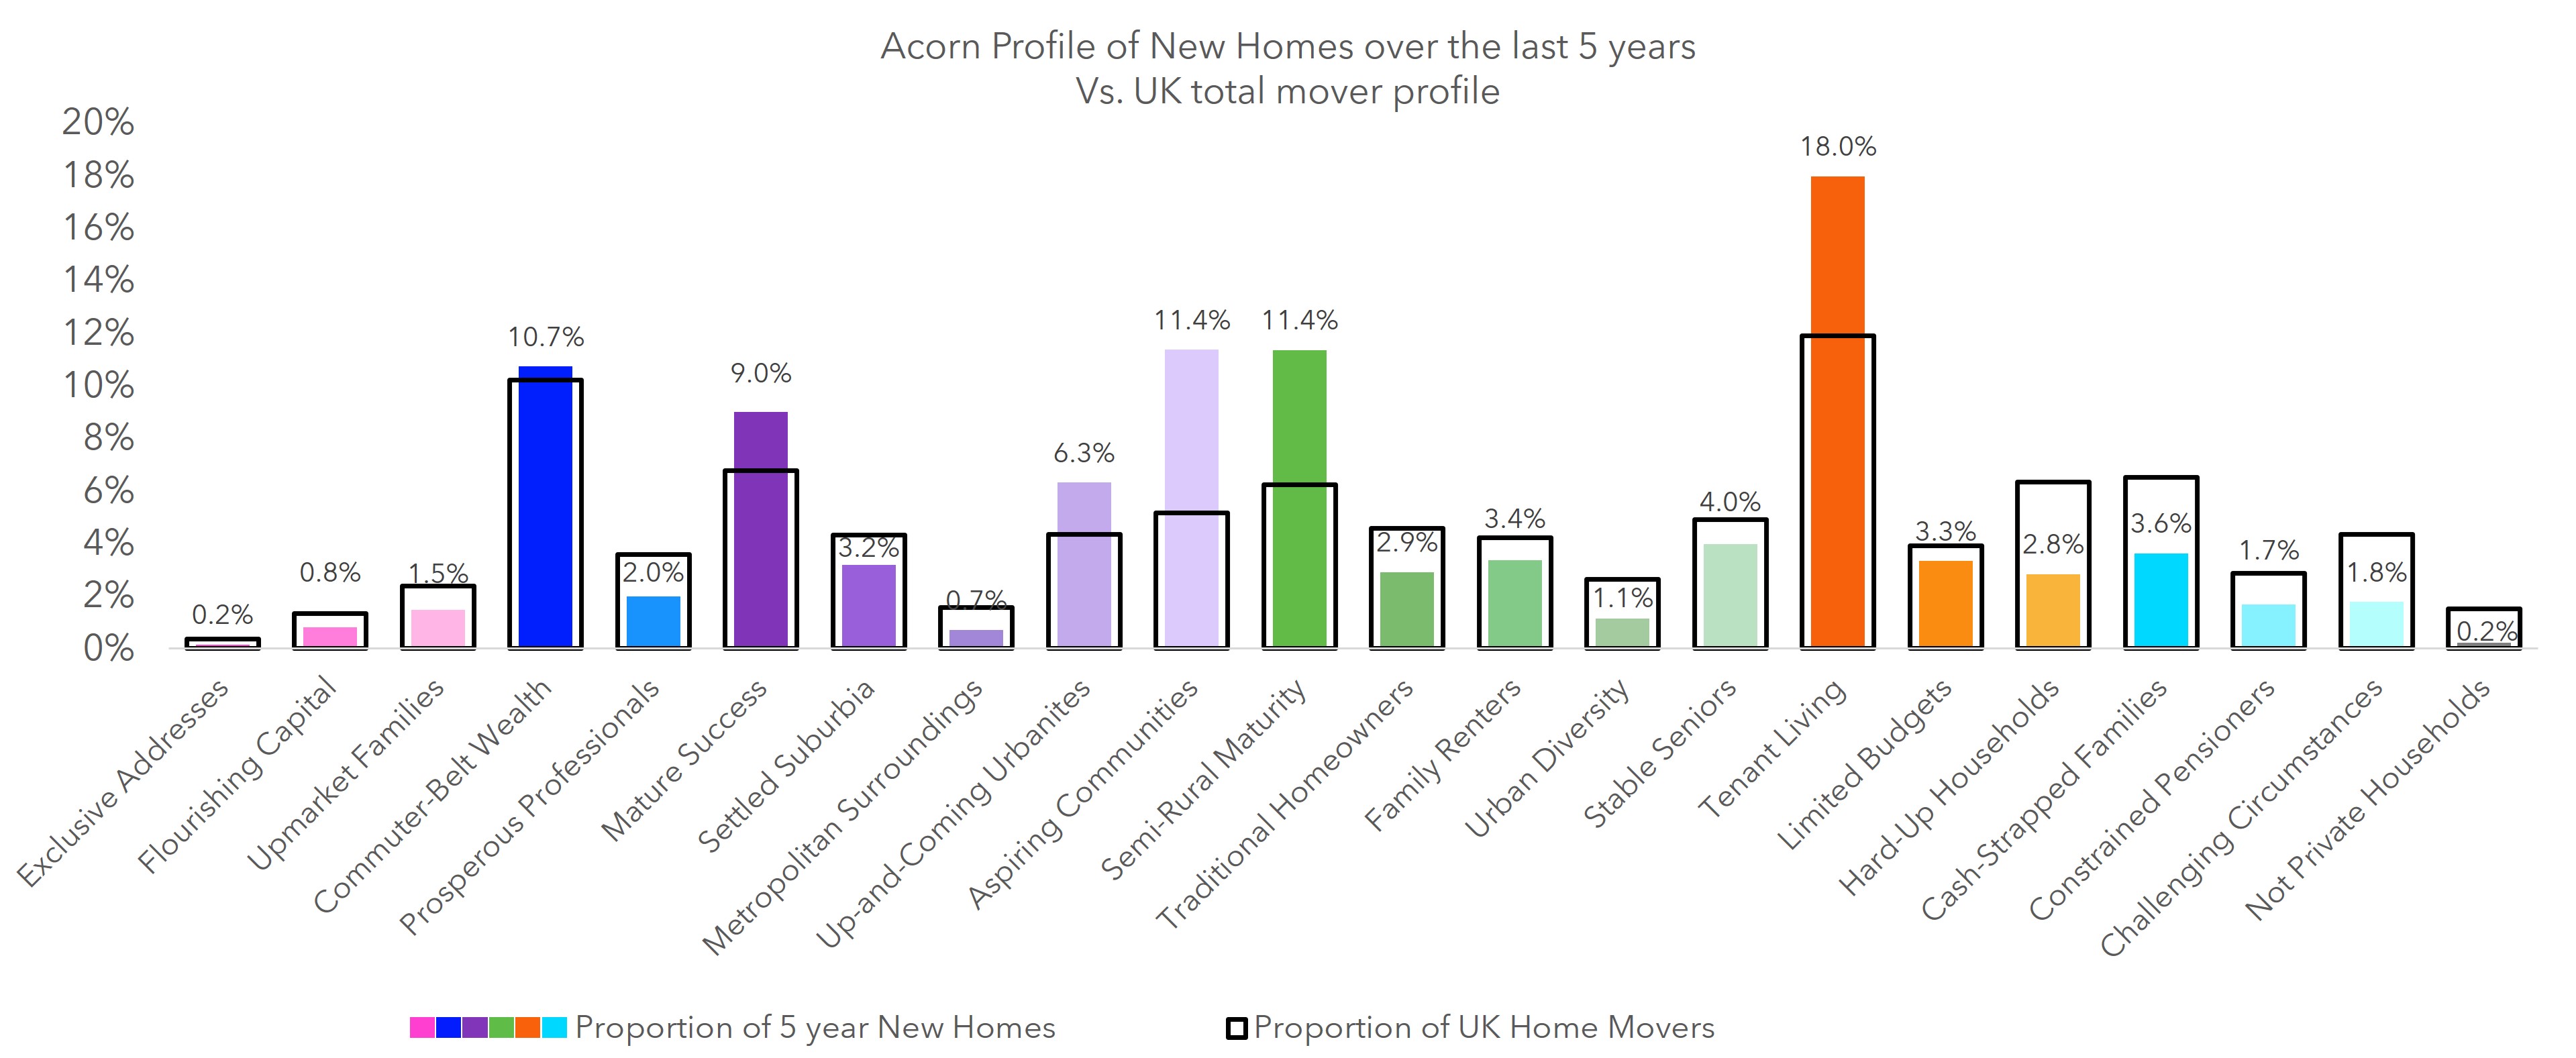
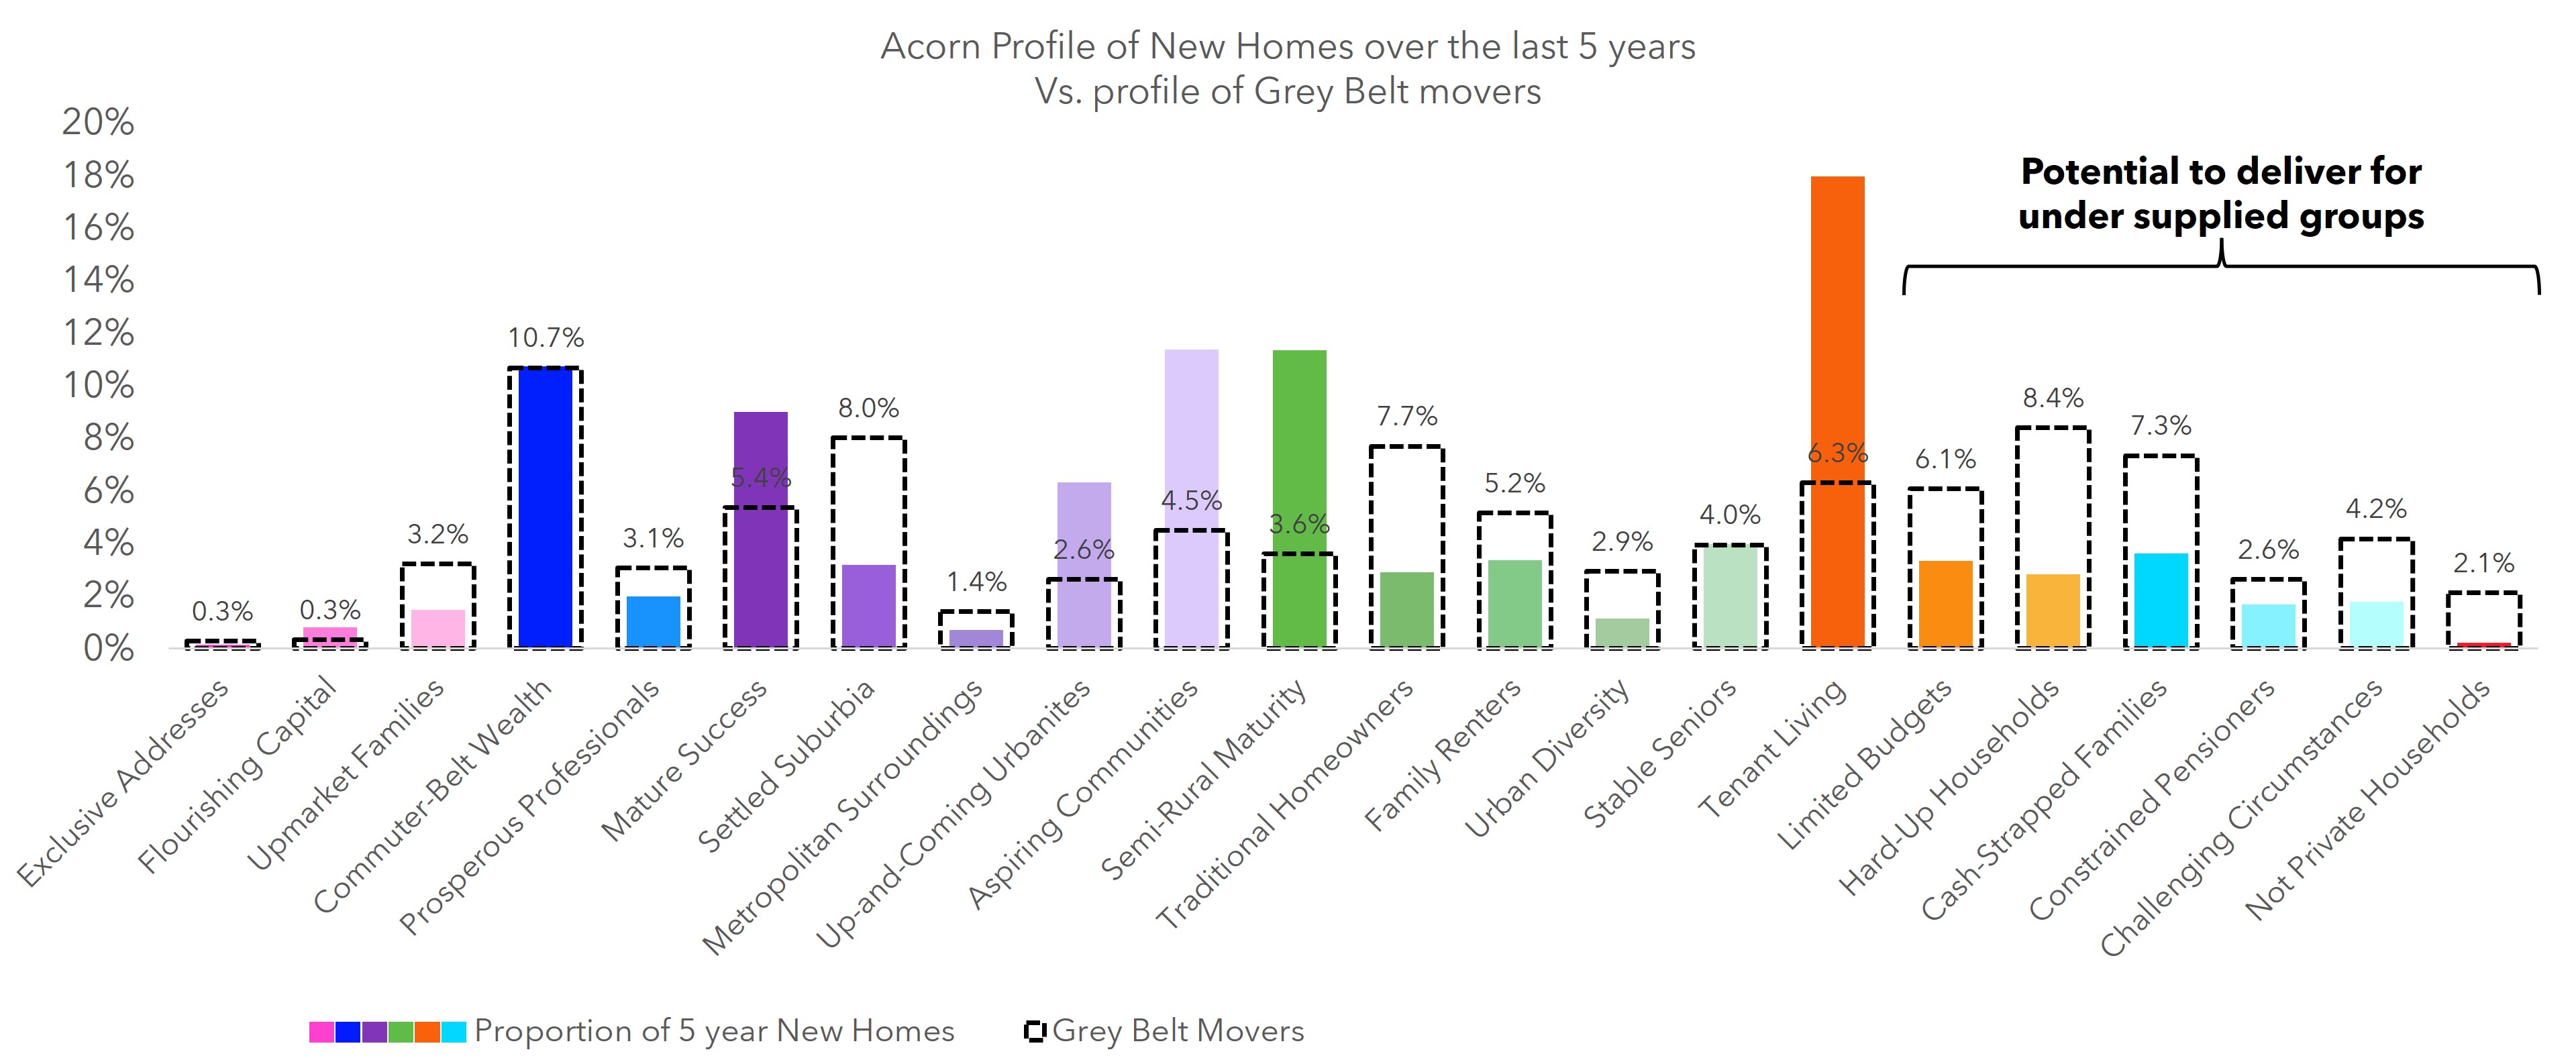
The accompanying data illustrates the national picture of the new grey belt strategy, highlighting the importance of addressing the housing needs of underserved groups. Housing development has traditionally focused on a few demographic clusters, with the “Tenant Living” group (18%) receiving a large share of new housing deliveries. This reflects a growing focus on affordable housing and rental markets, which are crucial for tackling the UK’s housing crisis. However, the grey belt strategy seeks to broaden this scope, opening up underutilised land for development to benefit a wider range of demographics, including “Limited Budgets” (3.3%) and “Hard-Up Households” (2.8%).

Further research conducted by CACI highlights the potential of grey belt sites to serve undersupplied groups. Data reveals that people living within two miles of potential grey belt sites skew towards lower affluence groups, which have historically been underserved in new housing developments. Groups such as “Limited Budgets” (6.1%), “Hard-Up Households” (8.4%) and “Cash-Strapped Families” (7.3%) represent a significant proportion of grey belt movers compared to the profile of new homes delivered over the past five years.

This shift indicates that the grey belt holds immense potential to cater to these underserved demographics, offering new housing opportunities that align more closely with the needs of lower-income populations. By unlocking development in the grey belt, the government has the opportunity to meet its housing targets while addressing the imbalances in housing availability for a broader spectrum of society. This strategy is not just about numbers; it’s about making housing accessible and affordable for the people who need it most.

How CACI can help?

Stay tuned for the next blog in this series, where we’ll explore the potential that this grey belt initiative has on the North West and Scotland. In the meantime, contact CACI to find out how you can ensure that your developments are meeting the demands of local movers.

Grey belt sites: what they are, locations & impact on housing

Grey belt sites: what they are, locations & impact on housing

In the previous blog within this series, CACI assessed the current state of the UK’s house building targets and how grey belt sites can lead to improved outcomes. Today, Virgin Land will dive deeper into what these grey belt sites are, including their locations and projected impact on the future of housing.  

 Grey belt sites explained: freeing land for homes

The UK’s ongoing housing crisis has left politicians and planners scrambling for solutions. To address the shortfall, the new Labour government has introduced a fresh approach: grey belt sites. But what exactly does this mean, and how might it help? 

“Grey belt” refers to parts of the green belt that the government believes can be reclassified for development. These areas, while part of the green belt, make limited contributions to the five core purposes of the green belt, like safeguarding the countryside or stopping towns from merging together. Since they no longer offer much in the way of environmental or spatial benefits, they could now be considered for development under new rules. The grey belt typically consists of previously developed land or parcels with minimal environmental or historical significance. By shifting these areas from green belt protection to grey belt status, the government hopes to balance the need for housing with environmental sustainability. In practice, grey belt sites include land that may have been industrially or commercially used in the past, or areas close to urban centres that are no longer agriculturally productive. These sites provide a critical opportunity to deliver housing where it’s most needed, particularly in regions where development has stagnated due to green belt restrictions. 

How many grey belt sites exist & where are they located?

At VirginLand, we’ve conducted an extensive study and found around 14,000 possible Grey Belt sites across England and Scotland, covering about 17,500 hectares. That’s just over 1% of all Green Belt land in the country, underscoring the selective nature of this reclassification. Most Grey Belt land can be found in older industrial towns, particularly in the Northwest and Midlands, where a whopping 64% of people in the Northwest live within two miles of a potential site (the national average is 38%). In future blog posts, we’ll take a closer look at the regions across the UK.

How could grey belt sites impact housing?

Reclassifying land as Grey Belt opens up a significant opportunity for housing development, especially in regions where supply has consistently failed to meet demand. Based on current estimates, if development were to proceed at an average density of 30 dwellings per hectare, the identified Grey Belt sites could accommodate around 525,000 new homes. If densities were to increase to 35 or 40 dwellings per hectare, the number could rise to 610,000 or even 700,000 homes. But even with this potential, the government still wants to focus on brownfield first approach before using any Grey Belt land. Local Planning Authorities (LPAs) are required to prioritise brownfield sites before considering greenfield or grey belt areas for development.

Future predictions of housing through grey belt sites

The grey belt idea is a big shift in how we think about land use, potentially opening up vast amounts of space for new housing. It’s especially promising for regions like the Northwest and Midlands, where building has been difficult in the past due to green belt restrictions. However, this isn’t a magic fix—some areas like London and the Southeast still face substantial challenges when it comes to housing. Making the most of grey belt land will take careful planning and input from the public to ensure that the right balance is struck. This new approach could help ease the housing crisis, but only if it’s rolled out thoughtfully. 

How Virgin Land and CACI help?

To find out more about ensuring your developments meet the demands of local movers, contact CACI and they will be touch.

* This insightful blog has been authored by Steve Norman and Sam Bedford from Virgin Land.

How grey belt sites will help tackle the UK housing crisis

How grey belt sites will help tackle the UK housing crisis

The UK has not been meeting its house building targets for some time. This is not new news, but it is worth reiterating the scale of shortfall. Over the past five years, we have consistently delivered 20% fewer homes than were targeted: a total miss of nearly 300,000 homes (or put another way, an entire year’s target). 

Couple this with projected population growth and we can see why house building has made its way up the political agenda. The population is expected to swell by 3.8 million people over the coming 10 years, and naturally, these people will need somewhere to live.  

In this blog series, CACI and Virgin Land will uncover key questions around the future of house building targets and how they can be addressed via grey belt sites, including their locations and desirability, whether they create suitable opportunities for inhabitants and how they vary by region.

Where should new house building targets be focused?

Population growth will concentrate around major towns and cities, especially given that 14 of the largest 15 towns and cities have projected growth rates that outstrip the UK average. However, cities are not always where the market has delivered new homes. In fact, eight of those top 15 towns and cities have housing delivery rates that lag behind the national average. Therefore, new housing targets should be geographically directed to the places that people want to live. 

Who should be the focus of house building targets?

Housing growth should be targeted at the people that need it most. Left to its own devices, the market has delivered new housing that concentrates around a few demographic groups. Using CACI’s Acorn segmentation to profile new homes delivered in the last five years, we can see clear trends in the data; Tenant Living (young, urban renters) comprise 18% of new homes but just 12% of the population, Semi-Rural Maturity and Mature Success (two affluent, older groups who are likely to be downsizing) collectively account for 20% of new homes but just 13% of the population. Lower affluent, urban families such as Limited Budgets, Hard-Up Households and Cash Strapped Families, however, have received disproportionately little housing development.  

This is not to lay blame on housebuilders; the commercial challenges of development in urban environments are clearly contributing factors, however, the impact is one of acute supply challenges in specific demographic groups who are coincidentally the groups most likely to be living in over-occupied housing. To maximise the impact of housebuilding initiatives, the route forward requires a more collaborative approach, which the newly formed MADE Partnership may well deliver. 

How will the grey belt make a difference for house building targets?

Central to the Labour government’s housing policy is the rezoning of poor-quality green belt sites into the “grey belt”, effectively opening swathes of previously unavailable land for development. But how influential could this policy change be? CACI and Virgin Land have partnered to uncover the potential impact that opening up the grey belt can have on housing market dynamics.  

How CACI can help? 

Stay tuned for the next blog in this series, where we’ll dive deeper into grey belts, their locations and their impact on housing. In the meantime, contact CACI to learn more about how you can ensure that your developments are meeting the demands of local movers.

Why retail destinations should invest in consumer experiences & perceptions

Why retail destinations should invest in consumer experiences & perceptions


Want to increase your visitors’ spend by 25%? Invest in your amenities.

Facilities are a vital part of retail and leisure destinations. Despite not directly producing turnover, they play an essential part in driving performance. Through research from our Shoppers Dimensions dataset– our database of over 1 million respondents across 270 UK-wide destinations which enables key performance indicator (KPI) benchmarking of assets against similar locations across the UK to contextualise performance and enhance decision-making– we analysed how various KPIs are impacted by consumers’ experiences and perceptions.

So, how exactly are services and amenities within retail destinations affecting consumers’ behaviours? How can retail destinations leverage these insights to bolster experiences and perceptions?

How do consumers’ overall shopping experiences influence their spending behaviours?

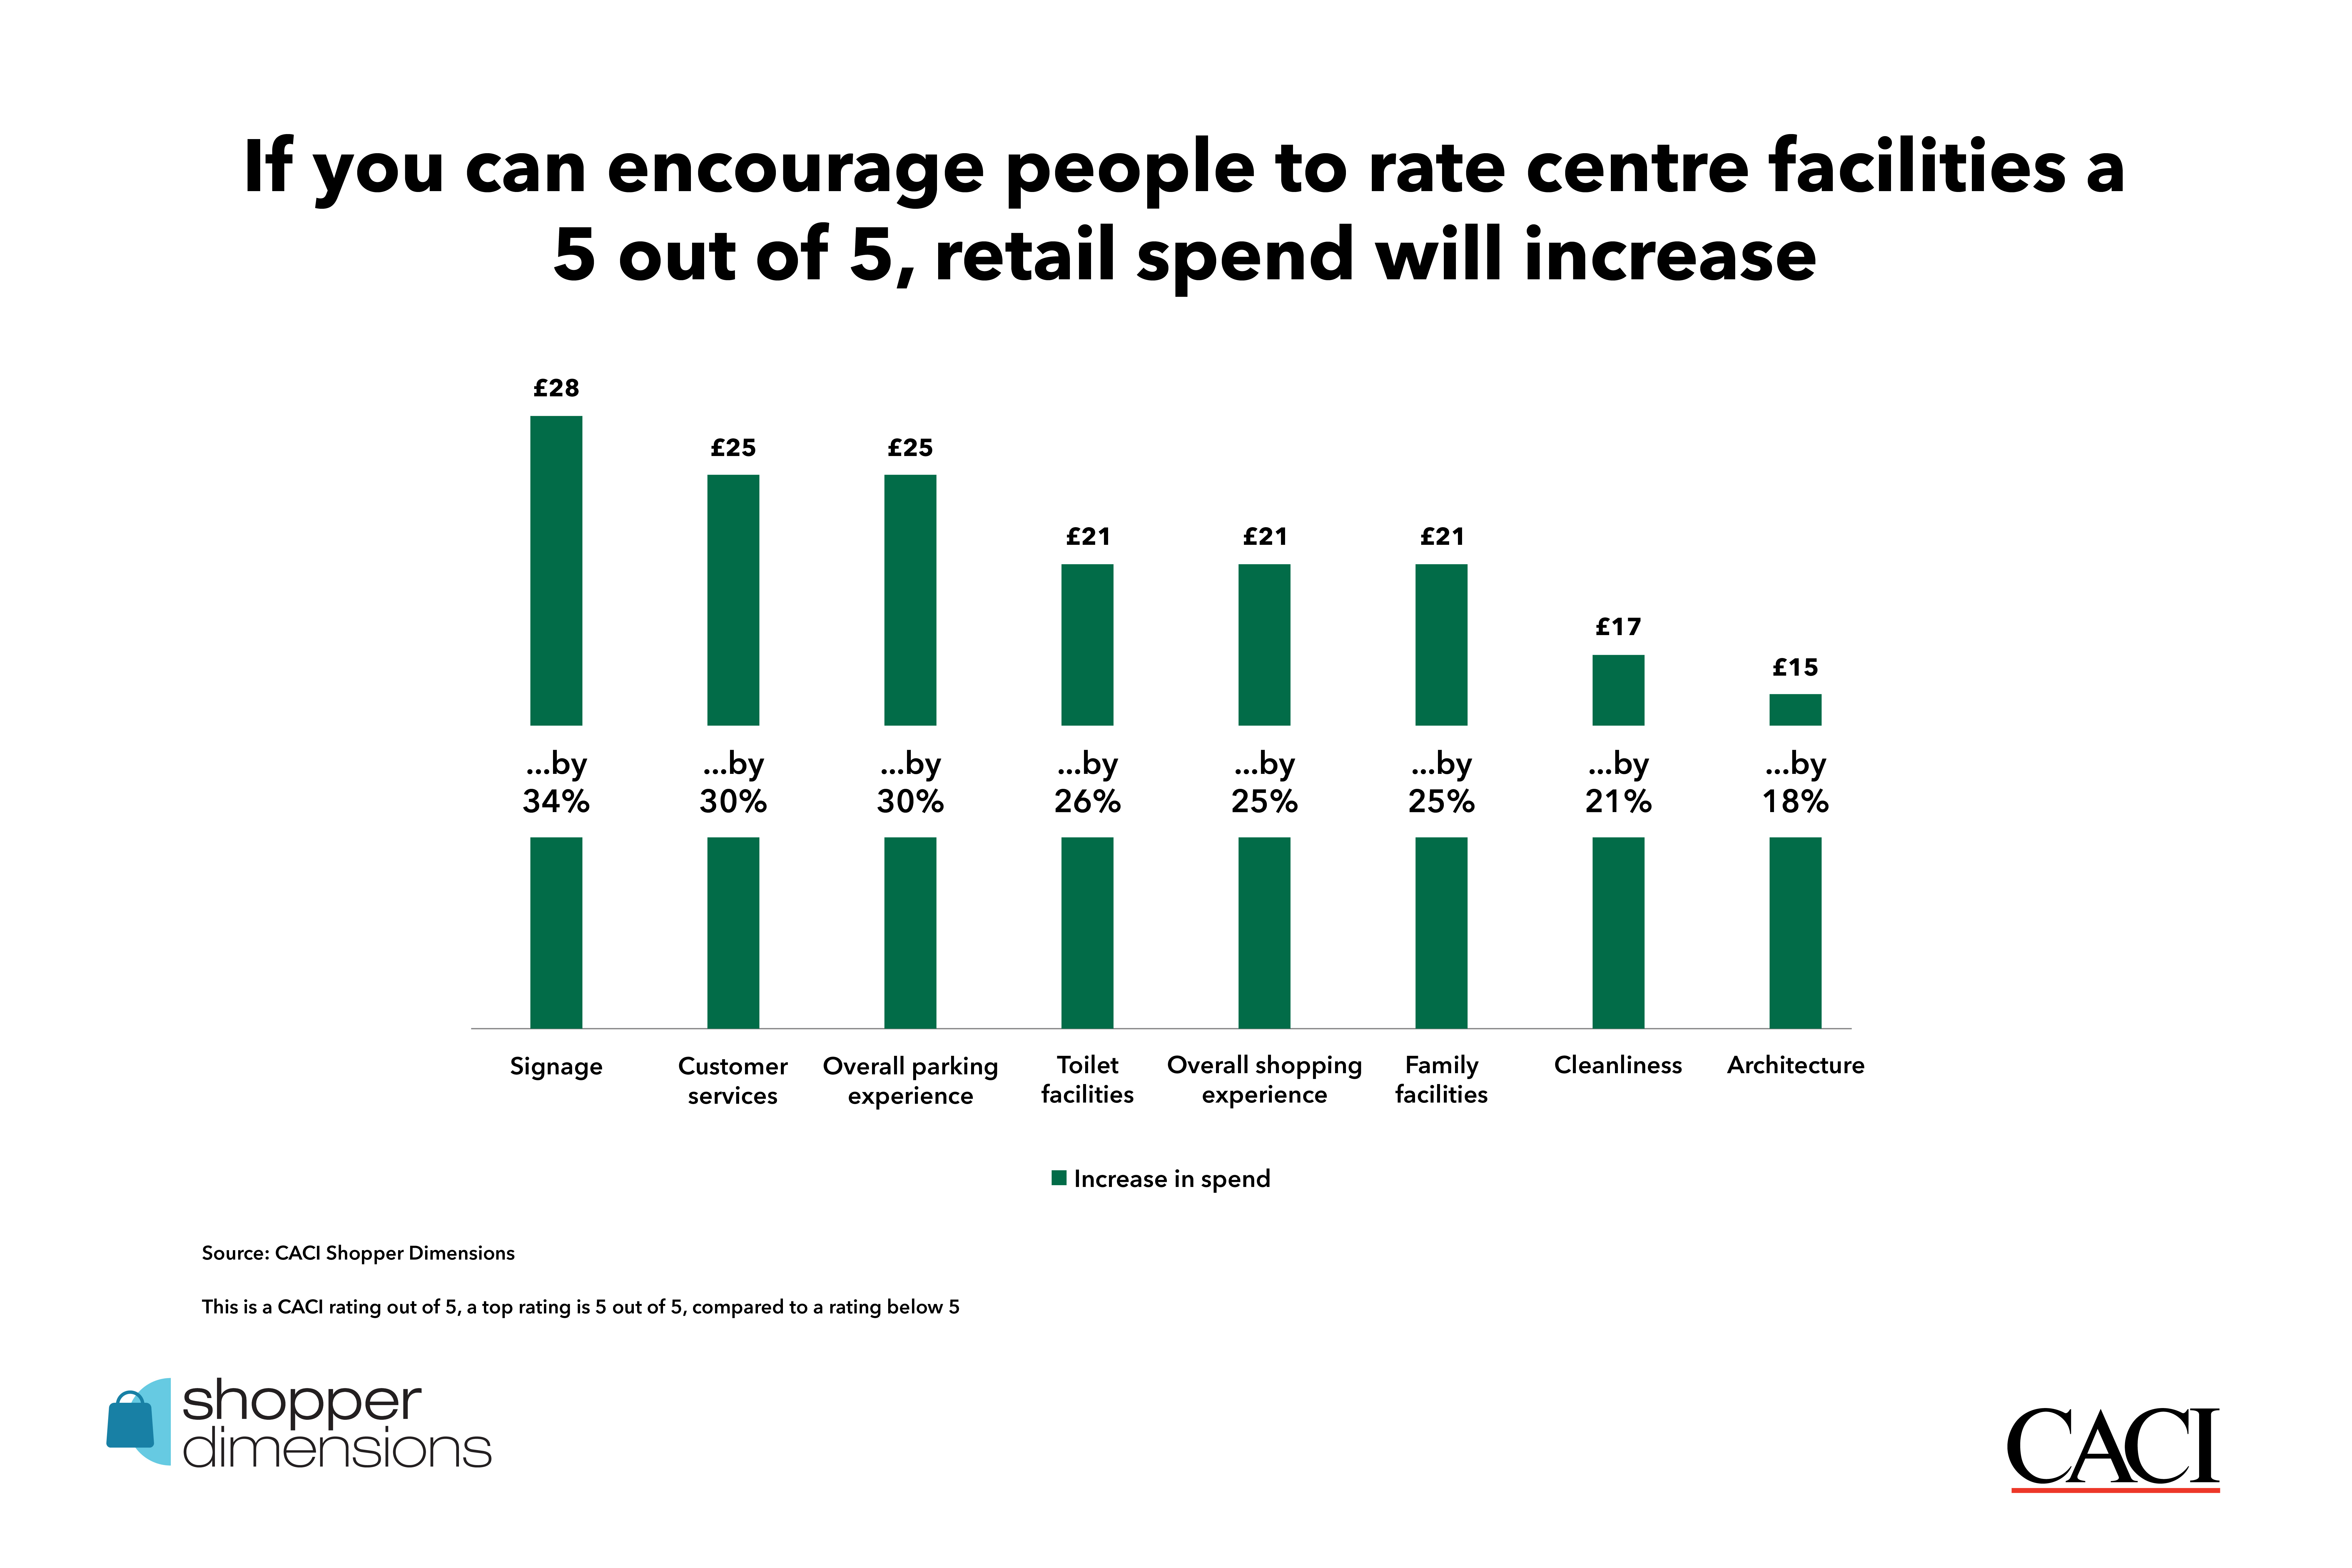
According to our research, retail destinations capable of improving their rating of a person’s overall shopping experience may recognise an increase in their average retail spend by £21. There is an uplift across the board when overall shopping experience is rated 5 out of 5, with average retail spend increasing by 25% and catering spend by 17%.

How do experiences & perceptions of toilets impact retail destinations?

It may not be a glamourous topic, but toilets are often called out by customers as an issue. They are expensive to renovate and maintain, and without a direct revenue stream associated with them, it is easy to think of toilets as a cost. Despite this, our data shows that investing in facilities can actually drive performance.

Firstly, when looking at shopping centre locations of those that rate the toilet facilities 5 out of 5, our data shows that this leads to an uplift in time that a person stays at the destination by 16%, which accounts for 12 additional minutes per customer. But how does this additional dwell time translate into spend? Customers that give toilets a top rating record a 26% uplift on their average retail spend, an increase of approximately £21.34 per customer.

Retail is not the only category affected. In fact, catering conversion experiences an uplift of 5 percentage points and the average spend on catering increases by 19%. There is therefore direct value to unlock by maintaining and improving these facilities, even if that means you have to spend a few pennies to do so.

How to attract more family groups from further afield 

Family groups can be a hard group to target, but once at the destination, they are likely to come for ‘Big Day Out’ trips which are associated with a higher average spend. For many destinations, this group tends to live further afield, such as in the suburbs of a city. When family facilities are rated higher, there is an uplift in their drivetime by 23%, an increase in their dwell time by 17% along with an uplift of 25% in  associated retail spend. Showing that better family facilities draw in these high-spending visitors from further away

How do car park experiences & perceptions impact interactions with the rest of the shopping centre?

One of the most interesting findings we came across when looking into the impact of ratings was with overall parking experience. This is another topic that consumers are passionate about; ever hard-to-please, the consumer wants it to be cheaper, with more spaces and of a better quality. But do better perceptions really lead to stronger key performance metrics? In short, the answer is a resounding “yes”. Those who rate the overall parking experience 5 out of 5 see an uplift in dwell, retail and catering average spend and conversion. The greatest uplifts are in dwell time and average retail spend. On average, dwell time will see an uplift of 17% (14 minutes) while average retail spend will see an uplift of 30%, leading to an average increase in spend of just over £25.

Key takeaway: higher perceptions equal higher spend

Overall, our data shows that the higher the perceptions, the more people will spend and the longer they will stay. This is the case when we look at the ratings for overall shopping experience, cleanliness, overall parking experience, family facilities, customer services, signage, architecture and toilet facilities. While it might not be glamourous, strong perceptions of parking experience and toilet facilities do lead to an increase in key performance indicators, proving that there is value to be unlocked by investing in these facilities.

How can CACI help?

At CACI, we understand the impact that driving improved perceptions of facilities within a retail destination can have on consumers’ behaviours, such as which amenities encourage people to visit from further away, stay longer or spend more on their trip. To gain a better understanding of how consumers interact with places, reach out to us to discuss how we can help you measure your performance and identify growth opportunities

Impact of turnover vs. footfall for shopping destinations in 2024

Impact of turnover vs. footfall for shopping destinations in 2024

Footfall has historically been the go-to method for measuring a shopping destination’s performance, conducted through pressure sensor mats, light sensors tracking shoppers’ entry and exit movements, advanced camera systems and more. Although ubiquitous across the retail industry, only measuring the number of people entering and exiting a store misses important aspects of true store performanceThe current pace of change in consumer behaviors demands that commercial landlords and occupiers know more about their performance drivers if they are going to thrive.

So, why is this the case? What do commercial landlords need to know about turnover and footfall to stay afloat?

How consumers’ changing behaviours towards shopping locations affect footfall

Since 2019, vendors across the UK have experienced an overall 11.5% drop in footfall. While this may sound like catastrophic news for retail destinations, the truth behind the headline footfall figures is perhaps surprising– an overall rise in consumer spending. Although a shift in consumers’ shopping behaviours is undeniably present, its impact may not be as profound as it seems.

Frequency has been a major driver of this, dropping by 31% over the last five years, meaning that consumers have been visiting shopping places much less often. However, the amount being spent by consumers when visiting shopping locations has climbed 29% over the last five years, counteracting declining footfall. 

This increase in trip spending is not just an inflationary rise – the fundamental reason to visit and our behaviours on visits have changed as a result. Successful locations are those that are adapting to the new shopper landscape.  

How consumers’ changing spending habits, values & “missions” affect footfall

What consumers are spending any disposable income on has also been changing. While retail conversion has remained relatively unchanged, there have been evident increases in Catering and Leisure conversions on the same trips, meaning consumers are increasingly combining a shopping trip with food/drink or a leisure activity. It is this combination of shopping, browsing, eating/drinking and leisure that has led to the overall increase in spending per trip.  

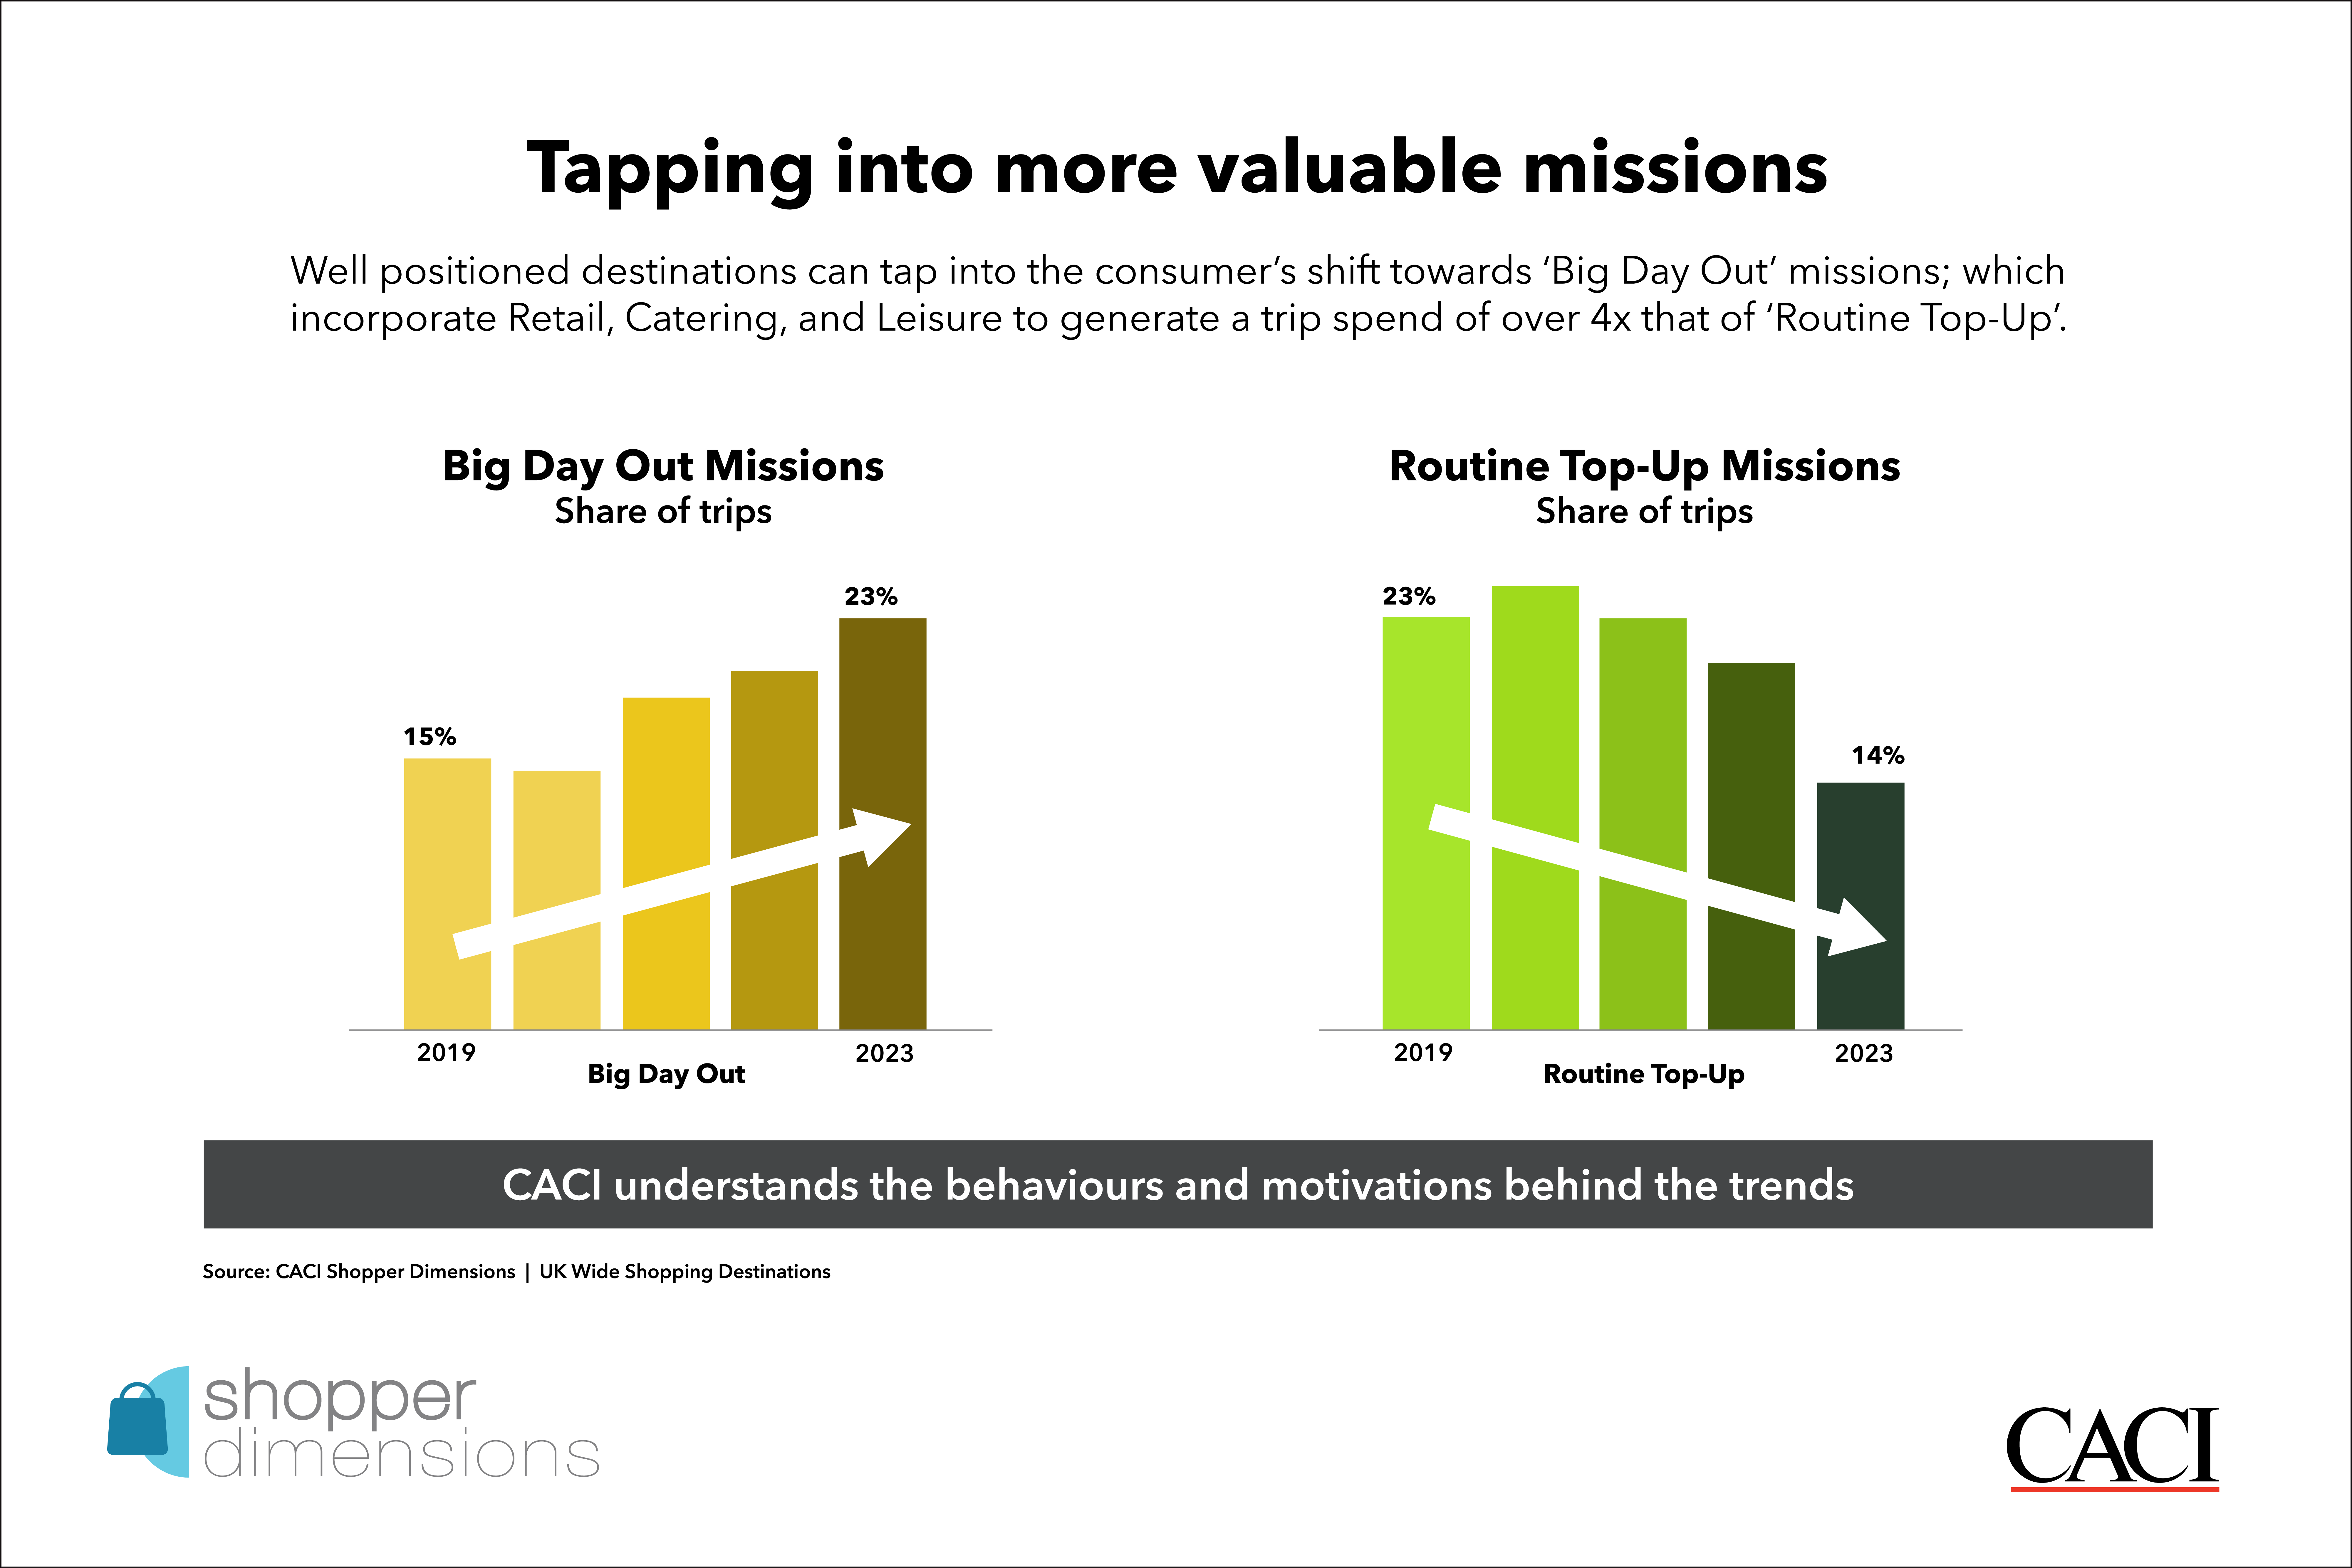
These comparisons can be illustrated through what we at CACI call “missions” from our Shopper Dimensions dataset, which illustrate the trip someone is on at a given time, and attribute “missions” to the tangible actions someone takes once at the shopping destination, such as browsing, spending, time spent, etc., to assign a “mission” to each trip.  

According to our findings, consumers are relinquishing their less engaged “missions” but concentrating trips around the “Big Day Out” trip. This is illustrated in the shifting profile of the top three missions in Shopping Destinations, which explains why a decline in footfall does not necessarily equate to declining spend. At a glance:

  • “Big day out” missions are our more engaged trips. They may be less frequent, but they are ones where multiple retail stores are often combined with Catering and Leisure, resulting in a trip spend 2.4x the average mission. Since 2019, these missions have grown to 23% of all shopping missions. 
  • 37% of “spending time” missions have no purchasing associated with them. While they may contribute to footfall figures, they do not directly contribute to sales-through-tills. Having dropped off post-Covid-19, these trips are now holding flat at a lower shelf. 
  • “Routine top-up” trips are quick, functional and emotionally disengaged trips that a spend of just 47% of an average trip. These trips are dropping out of our repertoire and can be substituted online.

We can therefore see that looking in greater detail at the changing nature of the trips made provides a clearer understanding of commercial asset performance than simply tracking the overall volume of trips.

Key levers to conclude turnover & application methods to target growth outcomes

To make a meaningful impact in asset performance, commercial landlords must move beyond measuring just the number of visits and start reporting the different levers of shopping location spend.  
 
While there are nuances behind the headlines that apply individually to each location, all spend at a shopping location can ultimately be boiled down to three key levers:

  1. The volume (number) of unique shoppers they have 
  2. The frequency of consumers’ visits to a shopping destination 
  3. The value that each shopper spends per trip.

Commercial landlords should consider applying the following methods to each lever to effectively target growth outcomes:

  1. Volume: Convert footfall (visits) into ‘spenders’ and target engagement strategies at driving scheme trial; measured by the percentage of the catchment population currently shopping with you (penetration). 
  2. Frequency: Embrace the different role that your asset plays for different cohorts, diversifying the occupier offering to give shoppers more reasons to return on different missions. 
  3. Value: Determine the highest spending shopper groups to target, segment customers and tailor offers to them to increase cross-shopping opportunities and drive value.

What does good look like?

Now is the time for commercial landlords to leave pre-pandemic comparisons behind. Footfall may be down overall, but the evolution of consumers’ shopping destination behaviour serves as a reminder that relying on the past as an indication of how assets should behave will not lead to longer-term success. If anything, these behaviours have demonstrated that the types of trips people continue to use shopping locations for are more engaged and valuable than ever before.  

Our unique view into how and where consumers are spending has been made possible with the help of datasets like Shopper Dimensions, which enable KPI benchmarking of assets against similar locations across the UK and leverage transactional and data spend insights to enhance decision-making. We can help you calculate the impact of each shopper metric and the headroom compared to peers and catchment.  

To find out more about what Shopper Dimensions can do for you and your business, speak to one of our experts today.

How Earls Court Development Company use data to help inform a new neighbourhood

How Earls Court Development Company use data to help inform a new neighbourhood

Background

The Earls Court Development Company (ECDC) has a vision to bring the wonder back to Earls Court. Their latest proposals demonstrate how Earls Court will be put back on the map, re-emerging as a destination to discover wonder, an ecosystem for creative talent and a showcase for one of the fastest growing industries in the world – clean and climate tech. The masterplan includes 4,000 new homes, 12,000 jobs, culture, community, retail, dining and leisure. 60% of the land is unbuilt, maximising open spaces and opportunities for nature to thrive. The site will have a series of cultural venues, alongside a commercial campus creating a global destination for clean and climate tech research and skills. Sustainability will be the green thread, with one of the largest zero-carbon energy loops in the UK powering the site. A hybrid planning application will be submitted this summer and the first phase will commence in 2026.

The Challenge

  • Understanding how current plans would impact the local market, what retail opportunities should be created and how to create a robust masterplan that would address these factors, despite London’s complex market and a high amount of local competition.
  • Gauging customers and audience — who is already here, what they do, what they need and where they go — in relation to other large-scale central London developments and regeneration master plans in King’s Cross and Battersea.
  • Prior to partnering with CACI, the company solely relied on qualitative data to understand peoples’ perceptions and inform their decision making, such as speaking to people within the community and stakeholders.

The Solution

ECDC was keen to ensure that an optimised neighbourhood would be created for residents both within and outside of the development along with workers and users of the space. To achieve this, CACI interpreted and analysed raw data and numbers for the company, bringing them to life and narrating the results through comparable’s and benchmarks.

It’s very clear in the presentations that we’re given — whether it’s for local authorities or internally — that the evidence base is robust and ultimately indisputable. That was helpful in providing that context and equips us with a robust way to create and define the master plan moving forwards.

Tom Branton, Development Director at ECDC

The CACI data sources included as part of this study were:

  • Mobile App Data: Mobile location data generated a precise view into the location’s catchment and visitor profiles, ensuring ECDC would innately understand how visitor profiles and their respective behaviours varied over time. This helped the company assess who users are along with their demographic and spending power, along with insights into how visits changed over a day and week.
  • Acorn: CACI’s consumer segmentation model, Acorn, enabled ECDC’s understanding of who new residents would be and their needs, and who would shop at the development.
  • Location Dynamics: Location Dynamics is CACI’s spatial interaction model, creating a digital mirror of the UK retail landscape replicating consumer flows. The engine of the model is a machine learning algorithm that provides future forecast catchments. For ECDC, CACI used Location Dynamics to understand the expected current catchment and spend, as well as leakage to nearby destinations, to provide a detailed understanding of the local retail landscape.

The Results

  • Newfound understanding of the ‘size of the prize’ of wider London and tourist demographics and audiences. ECDC historically relied on gut instinct when it came to decision making, but working with CACI ensured they were backed with concrete evidence. For example, CACI’s data showed that one-third of the total potential spend in the development area could come from out of catchment.
  • Enhanced decision-making through evidence-based data on the community. With the development situated across both the London Borough of Hammersmith and Fulham and the Royal Borough of Kensington and Chelsea, their perceptions of the surrounding community to inform decision-making — while strong — are now rooted in evidential data. This has served to alter their perceptions to ensure that a comprehensive understanding of residents and borough dwellers can be met and their audience narrative can be shaped accordingly.

The Future

In the coming years, CACI will continue to support ECDC in the data-backed planning and construction of residential units, retail landscape and office space development.

Read the case study:

You can access and download the full case study here. If you have any questions or want to learn more about CACI’s solutions, please get in touch with us.

Why Taunton is a perfectly balanced place to live

Why Taunton is a perfectly balanced place to live

This final blog in our series on balanced locations brings us to Taunton, an idyllic town near the southwest England countryside with a captivating history, landscapes and arts and culture scene that have earned the town its spot on our list of perfectly balanced places to live per our report, “Six Pillars of Success: Building Resilient Places”. 

If you have yet to read our blog that introduces these pillars, we consider a ‘perfectly balanced’ place to be:   

  • One that houses a suitable mix of chain and independent retailers at optimal sizes  
  • Supplies unique offline experiences that meet the community’s needs  
  • Provides community infrastructure that supports daily living  
  • Offers adequate residential properties for the community  
  • Offers employment opportunities and flexible working spaces  
  • Encourages time spent outdoors in green spaces

So, what exactly are the driving factors behind Taunton being a perfectly balanced place to live?

Pillar 1: Representation & proper sizing of independent & chain retailers  

Taunton’s town centre benefits from a mix of well-known brands like Primark, TK Maxx, Sports Direct and Marks & Spencer, while also being home to thriving independent and specialist retailers. In fact, independent retailers in Taunton comprise ~50% more of the retail mix than benchmark locations.

Bath Place stands out as a particular hub for independent retailers. Dating back to the 18th century, this historic street is lined with an array of independent businesses and services that can be reached on foot by pedestrians. Many of the shop fronts feature their original detailing to truly transport passers by into the Georgian era.  

Pillar 2: Uniquely tailored offline experiences

To get in on the sports, music and leisure scene in Taunton, Somerset County Cricket Club has something for every type of enthusiast. Founded in 1875, this renowned sports club situated close to the town centre represents the county of Somerset. To this day, it serves as a spot for watching cricket, attending concerts, catching a film at its open-air cinema and much more.

For those looking for a community social hub that doubles as a performing arts centre, look no further than Taunton Brewhouse. As the region’s principal arts centre, its programme of high-quality dance, musical and theatre shows along with workshops and pop-up shops create a diverse and all-encompassing environment that appeals to one and all.

There is also no shortage of cafes, restaurants and bars to satisfy locals day or night. 

Pillar 3: Engaging community infrastructure 

Taunton’s centre is brimming with museums, galleries, a library and numerous services to meet locals’ varying needs and interests.  

A visit to Taunton Castle, a Grade I Listed Scheduled Ancient Monument, can be paired with the Museum of Somerset, also situated within the 12th century castle walls, housing prehistoric artifacts to modern galleries. The Somerset Military Museum is also housed within the Museum of Somerset. A historic almshouse saved by the Taunton Heritage Trust can also be found on the Museum grounds.  

At the heart of the town lies Taunton Library, a public library that offers internet access and printing services. Civic services such as the Somerset Registration Service, Jobseekers Recruitment Services, Taunton JobCentre and the Somerset Council offices can also be found here.  

A modern and affordable Nuffield Health gym boasts plenty of equipment and classes, encouraging locals’ maintenance of fitness and wellbeing. 

Pillar 4: Support social cohesion through optimised residential design 

Situated close to the picturesque countryside while also having well-connected transport links, inhabitants of all ages and demographics can appreciate what this town has to offer. Taunton’s housing market appeals to a variety of renters and homebuyers, with a broad range of housing available from charming cottages to contemporary flats. Average house prices in Taunton are lower than seen across the southwest. At just £786, monthly rental payments sit at 22% of local income levels (below national averages of 25%).  

Pillar 5: Sufficient & accessible work opportunities for the local population

Taunton is a major regional employment hub. The town is accessible via the M5 and has good train links including a direct service to London in under two hours, making it an appealing place to live for commuters. Only 1.61% of Taunton’s population is considered to be “Economically Active: Unemployed”.
Pillar 6: Appealing open spaces for the community to dwell in 

When in need of a break from city life, locals and visitors can escape into one of Taunton’s many parks and nature oases.  

Vivary Park is a popular choice that is just a few minutes away from the town centre. With its namesake inherited from its medieval usage as a fish farm or vivarium for the priory and castle, the park features a mini golf course, tennis courts, playground and model railway. In just a short drive from Taunton, Blackdown Hills National Landscape, considered an Area of Outstanding Natural Beauty, can be found, offering visitors breathtaking landscapes and opportunities to hike, cycle and spot wildlife.

To learn how our six property pillars can help ensure you are creating resilient places, please speak to one of our Placemaking and Property experts.

Why St Neots is a perfectly balanced place to live

Why St Neots is a perfectly balanced place to live

This next blog in our series on balanced locations transports us to St Neots, a rapidly growing Cambridgeshire town with mediaeval heritage that is nestled along the River Great Ouse banks. With an intriguing blend of old-world and modern-day sights and amenities, a strong sense of a community and a picturesque atmosphere, St Neots was an undisputed pick as part of our list of perfectly balanced places to live per our report, “Six Pillars of Success: Building Resilient Places”.

If you have yet to read our blog that introduces these pillars, we consider a ‘perfectly balanced’ place to be:  

  • One that houses a suitable mix of chain and independent retailers at optimal sizes 
  • Supplies unique offline experiences that meet the community’s needs 
  • Provides community infrastructure that supports daily living 
  • Offers adequate residential properties for the community 
  • Offers employment opportunities and flexible working spaces 
  • Encourages time spent outdoors in green spaces.  

So, what exactly are the driving factors behind St Neots being a perfectly balanced place to live? 

Pillar 1: Representation & proper sizing of independent & chain retailers

St Neots features a strong provision of amenities and services. The town centre forms a well-balanced array of High Street brands like Fat Face and Argos and independent retailers accounting for 38% more of the retail offer than comparable locations, creating a strong sense of identity and place.  

For those looking for independently run wine, beer and spirits retailers, look no further than The Smiling Grape Company, an award-winning, family-owned wine merchant, or Shumë Bottle Emporium, a craft beer shop and bottle emporium carrying beers from around the world. Opting to put your creative skills to the test in an all-ages, all-skill levels pottery and craft studio? The Crafty Monkey Pottery Shop has something for everyone. 

The town’s market square is also one of the largest and most ancient in England, dating back to the 12th century. Every Thursday since its foundation, the Charter Market takes place here through the daytime, with stalls offering fresh produce, clothing and artisanal finds. There’s also a bi-weekly Saturday Farm and Craft Market featuring local traders and crafts makers offering meats and produce, baked goods, flowers and plants and handmade crafts. 

For special occasions, or even to spruce up an everyday space, the County Fayre Florist has been a prime choice for locals for over three decades. A Hotel Chocolat factory and cafe outlet is also popular among locals in search of high-quality chocolate at lower prices than on the High Street, or for an ice cream or hot chocolate treat at the cafe.

Pillar 2: Uniquely tailored offline experiences

St Neots’ strong catering offer is mainly independently led, with many multi-function restaurants and cafes for visitors to enjoy.  

Roberto’s Deli is one of these—part-deli and part-pizza restaurant, this authentic Italian deli offers artisanal produce alongside dine-in options, making it a hit with visitors. For an all-encompassing cafe, art gallery and creative hub experience, Art & Soul encourages visitors to savour moments of tranquility by viewing art, checking out a gig, getting some work done or catching up with friends over a coffee all in one place. The Pig n Falcon is also a popular watering hole among locals for its live music and warm, traditional pub atmosphere.  

While Pizza Express is the town centre’s only chain restaurant, a Cineworld is in its vicinity, making for a great evening on the town. In contrast, its independent restaurant selection (including Il Girasole) and pubs like The River Mill offer quality food and pet-friendly atmospheres. 

Locals and visitors will also find a bowling alley, library and museum in the town’s centre. A broad range of bars, restaurants and cafes also cater to a variety of food groups and preferences (Ferro Lounge, a vegan dog-friendly cafe, being one of them), along with a few small tearooms for vegan and gluten free visitors. 

Pillar 3: Engaging community infrastructure

Lining the town’s streets are large chain supermarkets like Waitrose and Marks & Spencer along with independent alteration, shoes, arts & crafts shops and beauty salons and health and community services, meeting locals’ various needs.

Overlooking the town is also the alluring (and unmissable) 130-foot tower of St Neots Parish Church. Originating in the 12th century and rebuilt in the 15th, it serves as a community hub for gatherings and for relishing the centuries of craftsmanship visible in both its interior and exterior. 

The town is also easily commutable from the neighbouring towns of Cambridge, Milton Keynes, Peterborough and more, with fast and direct train links to both London and Peterborough available. 

Pillar 4: Support social cohesion through optimised residential design

Housing in St Neots indulges a range of preferences and budgets, from Victorian and Edwardian homes and cottages to more modern developments. A combination of high earnings (£48,007 on average) and relatively low house prices (£306,497) contribute to the town’s affordability. Houses in the area are 6.4x the average salary (compared with a UK national average of 7.4x), and monthly average private rent payments of £877 account for 22% of earnings (against a UK town average of 26%).  

Terraced and detached properties have been increasingly sought after, along with semi-detached properties. The town’s proximity to larger cities like London, Cambridge and Peterborough has also appealed to many renters and homebuyers.  

Pillar 5: Sufficient & accessible work opportunities for the local population

Job opportunities are available in many sectors in St Neots, notably in healthcare, manufacturing and retail. A half-hour drive or hour-long public transportation commute to Cambridge opens plenty of additional working opportunities for St Neots locals, especially in technology and innovation. Nearly half (48%) of the adult population is employed full-time (against a UK average of 42%).  

There is also a community Facebook group, St Neots Referrals & Recommendations, where locals share recommendations and insights for new job listings.  

Pillar 6: Appealing open spaces for the community to dwell in

St. Neots is home to many parks and green spaces for locals and visitors to enjoy. With the River Great Ouse flowing through the town and parks just steps away from the town centre, breathtaking scenery can easily be found.  

Riverside Park, for example, is a popular destination for both locals and visitors, offering 72 acres of greenery that holds enormous weeping willow trees, picnic areas, children’s play areas and walking and cycling paths galore. Every Saturday, locals can partake in a free 5K parkrun, or can spend a lively Sunday attending one of the concerts held throughout the summer. Sports club events like the Dragon Boat Festival and St Neots Rowing Regatta are held in Riverside Park, making the most of the River Ouse. 

There’s also the historic Georgian era Priory Park, which now serves as an open space for leisurely activities like picnics and dog walking to sponsored events like runs and activity clubs for children in the summer. Sports enthusiasts can also make use of the park’s five football pitches and several mini soccer pitches.

For glimpses of some of the area’s richest wildlife habitats, a trip to Paxton Pits Nature Reserve, packed with 78 hectares of lakes, meadows, woodlands and more, promises sightings of nightingales, cormorants and several other varieties of birds and mammals

In the next and final blog of this series, we’ll share one more pick for a ‘perfectly balanced’ place to live.  
 
To learn how our six property pillars can help ensure you are creating resilient places, please speak to one of our Placemaking and Property experts.

Why Worcester is a perfectly balanced place to live

Why Worcester is a perfectly balanced place to live

In this fourth blog of our series looking at balanced locations, we’re travelling to Worcester, a captivating city in the heart of the West Midlands known for its storied history and architecture, triumphant sports and social culture and vibrant community gatherings.  

Worcester is packed with hidden gems and old haunts, medieval heritage sites and palatable dining options. These are a few of the many driving factors behind Worcester earning its place on our list of perfectly balanced places to live per our report, Six Pillars of Success: Building Resilient Places”.

If you have yet to read our blog that introduces these pillars, we consider a ‘perfectly balanced’ place to be:  

  • One that houses a suitable mix of chain and independent retailers at optimal sizes
  • Supplies unique offline experiences that meet the community’s needs
  • Provides community infrastructure that supports daily living
  • Offers adequate residential properties for the community
  • Offers employment opportunities and flexible working spaces
  • Encourages time spent outdoors in green spaces

So, what exactly are the driving factors behind Worcester being a perfectly balanced place to live?

Pillar 1: Representation & proper sizing of independent & chain retailers

While many larger chain retailers like Primark, New Look, The Body Shop and Boots can be found in Crowngate Shopping Centre, plenty of independent retailers are situated in the heart of Worcester, especially on Friar Street. From clothing shops and bridal studios like You Boutique and Perfections Bridal Studio to pet shops and toy shops like Paw & Co and The Entertainer, there is no shortage of retailers catering to the community’s unique needs.

Pillar 2: Uniquely tailored offline experiences

Events are a big deal in Worcester– from open-air concerts to community festivals, there is always something happening to engage and entertain visitors of all interests.

The Victorian Christmas Fayre is one of such examples. A beloved annual event that captures the essence of Victorian England by transforming the streets of Worcester into a scene reminiscent of the era of Queen Victoria, the Fayre fills the city streets with market stalls that offer traditional festive treats and crafts. Several historic buildings throughout the city also take part in the celebration, opening their doors to guests to awe at the Victorian era’s opulence. 

In the summer, locals and horse racing enthusiasts flock to Pitchcroft Park (otherwise known as Worcester Racecourse), a renowned thoroughbred horse racing venue. The annual Worcester Fringe Festival also brings theatre and arts aficionados to the city in the summer to revel in over 60 events dedicated to theatre, music and comedy at various venues. The musical fun doesn’t stop there— Worcester Fake Festival is returning to Pitchcroft Park this summer to deliver a tribute-based music event to local music lovers.  

Throughout the year, historical events paying tribute to Worcester’s rich history such as the Civil War Soldier School at The Commandery also offer children an opportunity to follow in the footsteps of Civil War soldiers.  

Football and cricket also form important parts of the city’s sports culture. Football is one of the most widely followed and played sports in the city, and cricket becomes particularly popular during the summer months. 

The High Street, Friar Street and New Street are also brimming with cafes and coffee shops (both independent and chains), pubs and restaurants. In fact, a recent initiative to renovate the Worcester Foregate Street railway station arches, The Arches, has brought together a new cluster of trendy restaurants, coffee shops, breweries and even axe throwing.  

Friar Street and New Street are also home to two of the city’s oldest, most historic pubs. The Cardinal’s Hat Inn on Friar Street is the oldest in the city, dating back to the fourteenth century. The King Charles House on New Street has a special tie to British history, as the home that King Charles II fled after defeat at the Battle of Worcester in 1651, aided by New Street’s residents holding the Cromwell army back for the King’s successful escape. 

Pillar 3: Engaging community infrastructure

In terms of amenities and services, Worcester’s High Street features large chain supermarkets like Tesco, banks like Barclays, NatWest and Lloyds, pharmacies like Boots and a Post Office. Neighbouring Friar Street and New Street house a number of barbers and hairdressers, as well as beauty salons.  

Worcester Cathedral in the heart of the city dates to the 12th century, showcasing the grandeur of English Gothic style. It not only serves as a place of worship, but as a cultural hub that hosts many events throughout the year. 

The Hive, a modern, high-tech library with rooms to hire and a cultural programme that sits alongside more traditional library resources, is also a thriving community resource accessible by university students and the public.  

Pillar 4: Support social cohesion through optimised residential design

At £44,246 per annum, household incomes in Worcester are in line with the UK average. Housing costs align with average earnings, with a range of affordable options from historic city centre properties to more modern developments beyond the centre available. With the average price of a home being £254,728 (5.8x the average earnings) and private rentals hovering around £701 PCM (19% of average earnings), Worcester’s affordability compared to most places of its size is evident. 

Pillar 5: Sufficient & accessible work opportunities for the local population

With 9.6% of Worcester’s adult population being full time students (above the national average, and likely a result of the University of Worcester’s presence), both educational and working opportunities are easily within reach.

The city’s prominent manufacturing scene has created many job opportunities in sectors like engineering and logistics. Full and part-time employment rates (at 45% and 14% respectively) sit above the national average. 2.3% of the population is unemployed but looking for work, a rate slightly below the national average.

This year, the Worcestershire Skills Show will also be taking place, exposing Year 7 to 10 students to an array of industries to help them understand what businesses are looking for in future employees and determine the necessary skills and qualifications to pursue their future career goals.  

Pillar 6: Appealing open spaces for the community to dwell in

Worcester’s green open spaces provide an escape from city life while also encouraging gatherings.  

For those interested in exploring the city on foot, daily walking tours are offered by guides from Discover History, Worcester Walks and Faithful CityWalk. For the adventurers, self-guided tours and trails of the City’s Guildhall, the Worcester Heritage Walk and more are available.

Britain’s longest river, the River Severn, runs through the city and offers walkways along the water with plenty of surrounding open spaces to spend time in. In the warmer seasons, boating enthusiasts can be seen rowing boats or canoes, and anglers can be found on the riverbanks. Those opting for a leisurely stroll or vigorous jog can utilise the pathways.

For a serene escape just a stone’s throw from the city centre, locals and visitors will find Gheluvelt Park, offering expansive green space and captivating landscapes, opportunities to hire paddleboats or row boats on Barbourne Brook, or play tennis. The park holds more significance than just its beauty— it memorialises the Battle of Gheluvelt, a defining moment in World War I that helped secure victory for the Allies.

Stay tuned for our next pick of a ‘perfectly balanced’ place to live in our upcoming blog.

To learn how our six property pillars can help ensure you are creating resilient places, please speak to one of our Placemaking and Property experts.