Why Taunton is a perfectly balanced place to live

Why Taunton is a perfectly balanced place to live

This final blog in our series on balanced locations brings us to Taunton, an idyllic town near the southwest England countryside with a captivating history, landscapes and arts and culture scene that have earned the town its spot on our list of perfectly balanced places to live per our report, “Six Pillars of Success: Building Resilient Places”. 

If you have yet to read our blog that introduces these pillars, we consider a ‘perfectly balanced’ place to be:   

  • One that houses a suitable mix of chain and independent retailers at optimal sizes  
  • Supplies unique offline experiences that meet the community’s needs  
  • Provides community infrastructure that supports daily living  
  • Offers adequate residential properties for the community  
  • Offers employment opportunities and flexible working spaces  
  • Encourages time spent outdoors in green spaces

So, what exactly are the driving factors behind Taunton being a perfectly balanced place to live?

Pillar 1: Representation & proper sizing of independent & chain retailers  

Taunton’s town centre benefits from a mix of well-known brands like Primark, TK Maxx, Sports Direct and Marks & Spencer, while also being home to thriving independent and specialist retailers. In fact, independent retailers in Taunton comprise ~50% more of the retail mix than benchmark locations.

Bath Place stands out as a particular hub for independent retailers. Dating back to the 18th century, this historic street is lined with an array of independent businesses and services that can be reached on foot by pedestrians. Many of the shop fronts feature their original detailing to truly transport passers by into the Georgian era.  

Pillar 2: Uniquely tailored offline experiences

To get in on the sports, music and leisure scene in Taunton, Somerset County Cricket Club has something for every type of enthusiast. Founded in 1875, this renowned sports club situated close to the town centre represents the county of Somerset. To this day, it serves as a spot for watching cricket, attending concerts, catching a film at its open-air cinema and much more.

For those looking for a community social hub that doubles as a performing arts centre, look no further than Taunton Brewhouse. As the region’s principal arts centre, its programme of high-quality dance, musical and theatre shows along with workshops and pop-up shops create a diverse and all-encompassing environment that appeals to one and all.

There is also no shortage of cafes, restaurants and bars to satisfy locals day or night. 

Pillar 3: Engaging community infrastructure 

Taunton’s centre is brimming with museums, galleries, a library and numerous services to meet locals’ varying needs and interests.  

A visit to Taunton Castle, a Grade I Listed Scheduled Ancient Monument, can be paired with the Museum of Somerset, also situated within the 12th century castle walls, housing prehistoric artifacts to modern galleries. The Somerset Military Museum is also housed within the Museum of Somerset. A historic almshouse saved by the Taunton Heritage Trust can also be found on the Museum grounds.  

At the heart of the town lies Taunton Library, a public library that offers internet access and printing services. Civic services such as the Somerset Registration Service, Jobseekers Recruitment Services, Taunton JobCentre and the Somerset Council offices can also be found here.  

A modern and affordable Nuffield Health gym boasts plenty of equipment and classes, encouraging locals’ maintenance of fitness and wellbeing. 

Pillar 4: Support social cohesion through optimised residential design 

Situated close to the picturesque countryside while also having well-connected transport links, inhabitants of all ages and demographics can appreciate what this town has to offer. Taunton’s housing market appeals to a variety of renters and homebuyers, with a broad range of housing available from charming cottages to contemporary flats. Average house prices in Taunton are lower than seen across the southwest. At just £786, monthly rental payments sit at 22% of local income levels (below national averages of 25%).  

Pillar 5: Sufficient & accessible work opportunities for the local population

Taunton is a major regional employment hub. The town is accessible via the M5 and has good train links including a direct service to London in under two hours, making it an appealing place to live for commuters. Only 1.61% of Taunton’s population is considered to be “Economically Active: Unemployed”.
Pillar 6: Appealing open spaces for the community to dwell in 

When in need of a break from city life, locals and visitors can escape into one of Taunton’s many parks and nature oases.  

Vivary Park is a popular choice that is just a few minutes away from the town centre. With its namesake inherited from its medieval usage as a fish farm or vivarium for the priory and castle, the park features a mini golf course, tennis courts, playground and model railway. In just a short drive from Taunton, Blackdown Hills National Landscape, considered an Area of Outstanding Natural Beauty, can be found, offering visitors breathtaking landscapes and opportunities to hike, cycle and spot wildlife.

To learn how our six property pillars can help ensure you are creating resilient places, please speak to one of our Placemaking and Property experts.

Defining ‘perfectly balanced’ places to live through Six Pillars of Success

Defining ‘perfectly balanced’ places to live through Six Pillars of Success

What makes a place ‘perfectly balanced’?  

Only 1.5% of locations across the UK can be described as balanced across all pillars. We set out to find these locations and determine what sets them apart in our report, “Six Pillars of Success: Building Resilient Places”, where we explored locations across the UK that are “balanced” in all six of CACI’s property pillars that contribute to the resilience of both community and place. Over 5,000 locations across the UK were assessed in this report, of which only 77 were considered balanced across all pillars.

Interestingly, only 1 in 20 regional towns in the UK are balanced. This demonstrates that despite achieving perfect balance in some places, there is still a lot that can be done for places to enhance their community engagement. 

In this blog series, we’ll uncover the defining criteria for ‘perfectly balanced’ places and find out how these communities’ tactics can be applied to other locations across the UK.

Pillar 1: Representation & proper sizing of independent & chain retailers

Having retailers that ensure a return on investment for occupiers and effectively appeal to locals’ needs along with proper leasing of a retailer in terms of its tenant line-up are critical to an area’s success. A ‘perfectly balanced’ place achieves a balance between chain retailers to boutique shops and independent retailers by understanding the core of their community’s personalities and values and reflecting that in the area’s retailers.  

Pillar 2: Uniquely tailored offline experiences

Unique offline experiences are ones that are only available in person and cannot be replicated at home. A place that is ‘perfectly balanced’ will host things to see and do for customers to do in person that come with halo benefits and contribute to the overall liveliness of the area and can only be experienced in person. The results will be achieved through an uptake of dwell time, varied footfall patterns, greater customer spending and more.  

Pillar 3: Engaging community infrastructure

The types of amenities and services offered in an area can play a vital role in enhancing social value and community engagement. A ‘perfectly balanced’ place has optimised its relationship between supply and demand across amenities to help commercial landlords plug gaps within the community and reinforce social value.  

Pillar 4: Support social cohesion through optimised residential design

A lack of suitable housing can be damaging for an area. ‘Perfectly balanced’ places optimise their residential design to positively influence the community and create long-term value, income and footfall for developers. These places typically feature residential units that closely align with the needs of the community and offer the right types, tenures, sizes and price points to fill supply gaps

Pillar 5: Sufficient & accessible work opportunities for the local population

Communities need job opportunities for those looking for employment. Acute un- and under-employment can be damaging on both an individual and community-wide basis. In our post-pandemic world, 29% of the UK population work in hybrid roles, allowing them the option of splitting their work week between the office and home. A ‘perfectly balanced’ place offers working opportunities that reflect the demand levels of the area and increasingly include collaborative, co-working spaces.  

Pillar 6: Appealing open spaces for the community to dwell in

To drive footfall to a location, a ‘perfectly balanced’ place draws people into spending their leisure time there. It will be conveniently located, offer appealing services and amenities and encourage dwelling and exploring. With an increased interest in greening urban environments and finding pockets of greenery in even the most unexpected spots, ‘perfectly balanced’ places will offer luscious open spaces that are built sustainably and encourage biodiversity and carbon capture. 

Stay tuned for our upcoming blog featuring the first two of our top five ‘perfectly balanced’ places to live. 

To learn how our six property pillars can help ensure you are creating resilient places, please speak to one of our Placemaking and Property experts.

How InSite helped Knight Frank navigate real estate & capital investment

How InSite helped Knight Frank navigate real estate & capital investment


About Knight Frank

For over 20 years, Knight Frank has partnered with CACI to achieve a long-term vision of becoming the world’s leading independent property advisor. Knight Frank works with various industries and businesses on their property and location planning strategies. Accessibility to reliable and accurate information to successfully serve clients and the ability to build authority as a market leading commercial agent have remained at the business’ core throughout.

Despite Knight Frank’s wider recognition for its work within residential property, the business is evenly split between residential and commercial real estate. In recent years, the general climate surrounding realty has become increasingly challenging, with macroeconomic conditions weighing heavily on this industry globally, particularly in terms of capital market investments. To manoeuvre these challenges, Knight Frank has been using CACI’s GIS software, InSite, along with various CACI datasets such as Acorn, the UK’s leading geodemographic segmentation tool.

The Challenge

Knight Frank’s primary challenges have been twofold:
• Determine how to navigate ongoing global uncertainty in the real estate industry.
• Handle volatility in capital investment markets.

Stephen Springham, Head of Retail Research at Knight Frank, elaborated on the impact that these challenges have had on the business.

Stephen explained:

Capital market investment is key to real estate markets and obviously that is probably at the sharpest end of economic sentiment. Investor sentiment isn’t sky high at the moment, so that is probably the biggest barrier we have to overcome, although we’re probably not radically different from most global companies in that regard.

The Solution

CACI’s InSite software has significantly supported Knight Frank’s business endeavours through both the nationwide insight from Acorn, as well as the shopper understanding from the machine-learning
catchment model, Retail Footprint. “It’s a window to the world of data. A lot of those datasets are bespoke and unique to CACI,” Stephen explained.

Additionally, CACI’s business consultancy solutions and thought leadership have been supporting Knight Frank in improving their overall business functions by supplying the business with the necessary tools to effectively advise retailers and support due diligence regarding buying and selling within the capital market.

The Results

According to Stephen, there has been a noticeable uptake across the business in data usage, with several transactions on shopping centres Knight Frank completed over the course of last year that were achieved
thanks to the support of CACI’s data and InSite tool.

One of the business’ recent and most notable acquisitions came in 2021, with Knight Frank acting for Redical in the purchase of the Victoria Gate/Victoria Quarter Shopping Centre in Leeds. This £120-million deal was executed in part through a deep dive of data provided by CACI’s InSite tool.

The Future

While Knight Frank continues to have an open dialogue with CACI on any new developments or datasets that could continue to support the business’ initiatives, CACI’s InSite and data have created a notable foundation.

Read the full customer story here. For more information on how our data and solutions can support your business growth please get in touch with us.

How cost of living is impacting the Elderly Care & Senior Living market

How cost of living is impacting the Elderly Care & Senior Living market

How does a challenging economy affect consumer choices and priorities that shape the UK market for elderly care?

It’s no surprise that the cost of living squeeze is having an impact on elderly care operators. Private residential and domestic care cost money: consumers are looking for ways to economise. Older people want and need comfort and care as much as ever, but they and their families are tightening their belts. Inevitably, they’re considering the cost of different care settings and options.

What does this mean for residential and domiciliary care providers? It’s early days, but as for every other consumer sector, you need to be prepared for the market to change. A proactive approach to understanding current and future customers and modelling potential demand in your locations can uncover opportunities to maintain occupancy and optimise your services to match evolving priorities and needs.

If you don’t have a crystal ball to hand, that may sound like a tall order. But knowing and anticipating market demand in your locations doesn’t depend on magic or guesswork. Consumer and location data together provide reliable evidence that can help you identify ways to stay relevant, accessible and financially stable.

Not all groups are impacted to the same extent by the rising costs of living. The majority of Acorn Groups still have a sizeable disposable income despite the recent 5% average fall.
Source: CACI Paycheck Disposable Income 2022 v2

Despite the bleak headlines, the economic impact varies considerably for different household types and in different areas. Many older consumers still have savings, disposable income or assets that allow them to choose the care they want. If you can understand the profile of your current and future customers in detail, it’s easier to identify and reach out to local prospects.

Location intelligence data is a well-established source of insight for care home operators and domestic care providers that are considering expansion or new sites. Mapping the age and affluence of the local population in a potential catchment helps to indicate where there’s likely demand for elderly care services.

But alongside age and income, there’s a lot of more subtle data that can help you market your existing services, confirm or reshape your propositions, benchmark your pricing and adjust the range and type of services you offer. This type of insight is extremely useful in a fast-changing market.

CACI data insight can answer crucial questions about your customers and market:

• What are the characteristics of your local and target customers?
Acorn profiling groups UK consumers by affluence, life stage and priorities
What are your current and potential customers thinking, feeling and intending to do differently?
   Quarterly Consumer insight surveys of the UK population
• How has customer spending on different outgoings changed?
Transactional spending data shows the split of spend with different brands and operators
• Whose disposable income is affected?
Postcode model of income in different locations, showing how it’s being spent.
• What’s around the corner?
Dynamic modelling forecasts what could happen to consumer spending if inflation, fuel and other costs rise in a range of different ways

CACI’s current disposable income model reflects the changes we’ve observed in the last few months. Although all households are affected by rising costs, the majority of our Acorn consumer profile groups still have a significant disposable income. It’s groups like Student Life and City Sophisticates that have seen the largest decline, driven by property costs.

There has been major growth in spend on private healthcare, with a wide range of demographics prioritising health over other non-essential spending.
Source: CACI Transactional Spend, June 2022

For elderly care operators, it’s encouraging to note that Comfortable Seniors, Countryside Communities and Successful Suburbs, who are likely to form far more of the target market, have some of the highest levels of disposable income, reflecting smaller or non-existent mortgages, good pensions and comfortable savings accrued over previous years.

Spending on private healthcare has increased in the past year. The Covid-19 pandemic and concerns about NHS waiting lists are driving this change in priorities for households across most Acorn groups. Despite rising essential costs, many consumers now regard healthcare expenditure as a necessity, not a luxury. This could have a positive impact on perceptions of value in elderly care.

These are just the headlines from our latest national data. Every elderly care provider has a different operating model and works in unique locations. CACI’s health and social care team can select data and build customised reports that directly reflect the opportunities and changes happening in your catchment areas today and tomorrow. For mid-sized operators, it’s vital decision-making information to inform strategy and tactical decisions that will help your business compete and thrive in a challenging economy.

We can help you:
• Continuously analyse, monitor and adapt – stay ahead of policy and new competitors when finding new customers and recruits
• Tailor marketing engagement and recruitment key messages to reflect the requirements of local potential pools of customers and staff
• Understand your staff and customer base and how its segments are impacted by different cost of living challenges, to identify risk and opportunity
• Tailor your offer to changing consumer and staff requirements

CACI’s specialist elderly care and senior living team work with clients in the UK and internationally to help them improve operational and financial performance with access to vital insights into their customers, employees and locations.

To find out more, contact us.

The growth of online: a surprising pivot in 2023

The growth of online: a surprising pivot in 2023

Over the last three years, we have seen a more significant shift in consumer habits than we could have imagined. Currently challenged by the rising cost of living and an economy in recession, the post-pandemic spending bubble was cut much shorter than initially anticipated by economists.

Like everyone in January, CACI reflected on the last few years, and as part of this, we revisited predictions that we made during the height of the Covid-19 pandemic. Consumer behaviour changed significantly in the space of several days, triggered by widespread temporary store closures during the lockdowns. Some stores were never able to reopen; whilst online platforms boomed, in light of these significant behavioural shifts, CACI rebuilt predictions to reflect this new normal.

How close were CACI’s consumer online spending predictions to actual results?

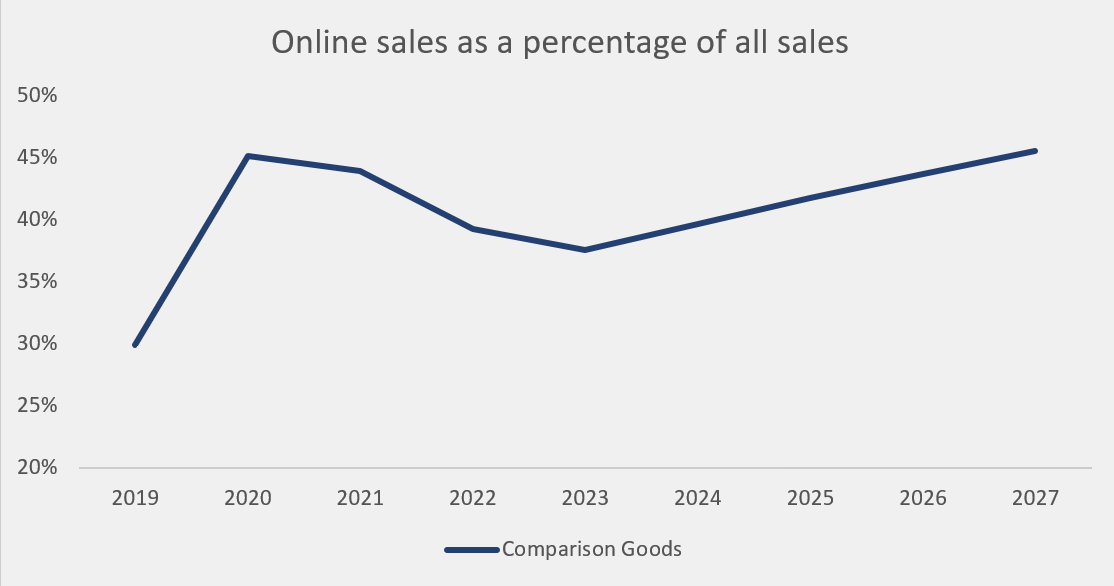
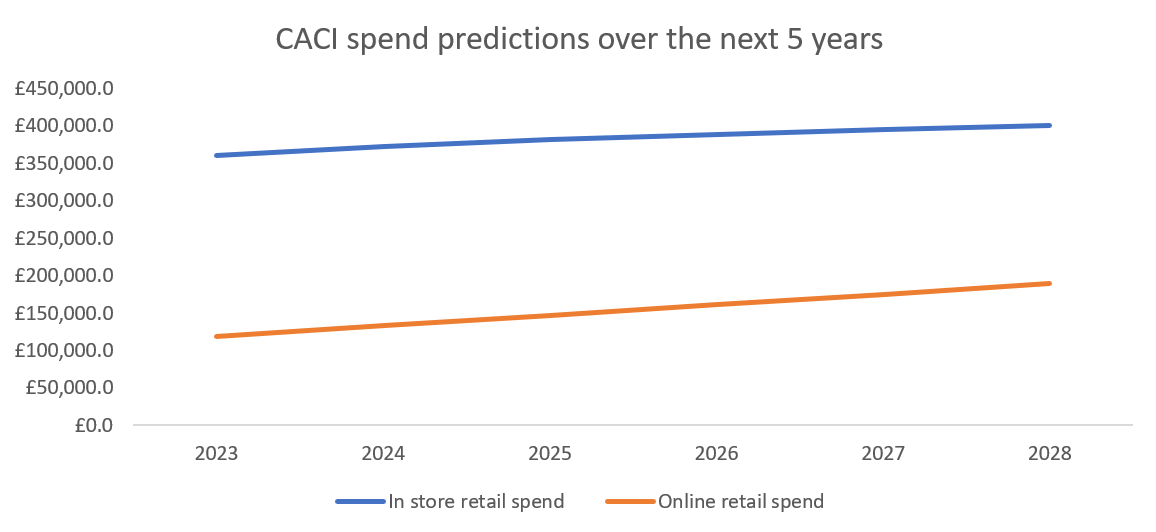
Mirroring our spend predictions, a phrase we maintained at CACI at the time was that “online spend jumped forwards five years in one month”. What we have come to realise was that three years on, these spend predictions, shown in the below chart, highlighting a return to in-store, were very close to the true picture.

How can CACI track consumer online spend behaviour?

CACI can unpick these new trends in spend behaviour using our new and exciting tool kit of Spend Dimensions and Brand Dimensions, which tracks over 200 shopping centres and 300 brands across the UK.

What we can see demonstrated in the above chart is a post-pandemic slump in online spend as a proportion of total spend. In 2023, online spend falls to 38%, before gradually rising again in the preceding years.

Whilst the current split in online and offline engagement provides us with an overall national average, it is important not to expect all shoppers to follow suit. We have seen asset type, product category, brand, region and demographics all play a big part in the extent to which a shopper might engage online.

Who is most likely to shop online?

Demographically, the split between those engaging in-store and online has become less distinct, highlighting the closing of the digital gap between young and old, with the difference between online market share across all groups dropping from 10% to 5% over the last year.

However, the big picture doesn’t change. Key online shoppers continue to be younger shoppers across the affluence spectrum as well as more affluent shoppers, likely driven by greater access to e-commerce platforms and the ability to afford delivery costs.

How does this vary by product category?

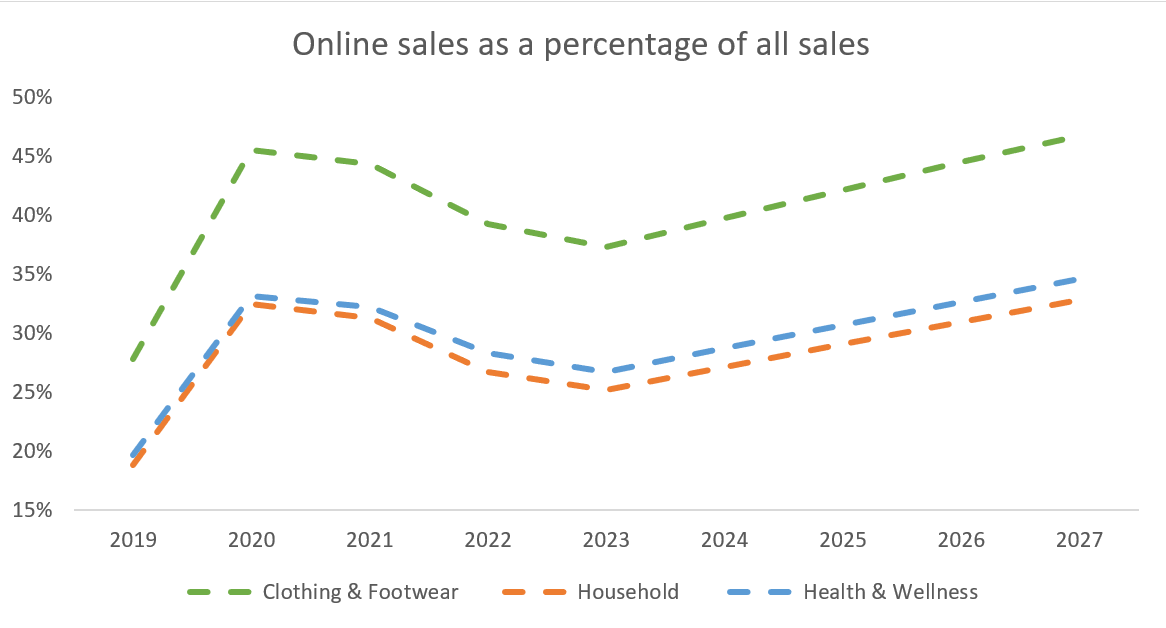
The recent shift back towards in-store engagement isn’t clear-cut and does vary by product category. CACI expectations were that the drivers of the overall return to the store would be clothing and footwear, household and health & wellness brands. This has been the general spend trend that we’ve been seeing across the UK since 2020.

The variation by category gets further exacerbated by the time of year. For example, comparing the months of October to December 2021 and 2022 in the chart below, there was a clear shift for household and kids’ goods spend to in-store, likely driven by the desire to experience before purchasing. Whereas, General Retail painted an interesting picture within the final quarter of 2022. Both in 2020 and 2021, with Black Friday and Cyber Monday taking place in November, Christmas hit online earlier than in-store, boosting online’s share of the market temporarily. In December, our Christmas survey reiterated this sentiment, with over half of those shopping online citing a main drive of this being concern with the rising cost of living and saving money, whereas over half of those shopping in-store did so for the experience. The experience-focused, in-store shoppers drove the resurgence year-on-year of in-store spend in December.

What does the return to in-store mean for retailers?

Across the 300 brands we tracked, many pure online brands are experiencing a decline in market share, in-store brands have typically performed well, and those blended brands have seen a shift towards a greater in-store market share. The power of the store can be seen through brands such as Decathlon, Nespresso, Build-A-Bear and Denby, who have all shifted to greater reliance on the store over the last quarter. In comparison, online disrupter brands such as Vinted and Shein which thrived through the year began to see a drop off.

What does the future of consumer online spending behaviours look like?

Whilst 2022 did represent a return to bricks and mortar, we are still at least a year ahead of where we would have been if the pandemic hadn’t happened. We expect to see continued growth in both on and offline retail spend, although proportionally online spend will increase.


However, it is undoubtedly true that we are currently, and will continue to, experience unexpected macroeconomic challenges which will impact different brands and destinations in different ways. Brands can no longer rely on their name as we have seen with the casualties of too many well-known landlords and retailers. Therefore, making informed decisions through the use of CACI data will help retain a competitive advantage and stand out from the market.

To learn more about how CACI can help your brand navigate changing consumer spending habits, get in touch with us here.

Delivering data & insights to provide Bright Horizons with a new approach to childcare

Delivering data & insights to provide Bright Horizons with a new approach to childcare

Highlights

• Bespoke data dashboard and InSite tools
• Acorn geodemographic data for multiple propositions and locations
• Customer and employee profiling to assess community need
• Enabling demand-led growth for genuine customer value
• Rapid report generation to inform many stakeholders

About Bright Horizons

Trusted by families to look after their children for over 30 years, Bright Horizons is an award-winning nursery provider. The company operates over 300 community and workplace nurseries throughout the UK: each is individually designed to serve the needs of its community. Bright Horizons provides tailored childcare for corporate clients and for families, at home, at work and in local settings.

The Challenge

Bright Horizons initially approached CACI for data to support their new site opening and acquisition insight programme. Property Asset Manager Oliver Brookes needed reliable data that was quick and easy to interpret for new site and location decision-making.

Marketing Manager Eddie Thorogood saw a further opportunity to use demographic data to support Bright Horizons’ proposition development and to better understand existing as well as potential catchments.

The Solution

CACI provided Acorn demographics, profiling and mapping, giving insight into specific postcodes and communities. High level demographic maps are instantly visible in InSite’s Locator tool.
Eddie explains: “The blend of data creates reliable and up-to-date information about the demand for our services, to support decision-making about how and where we can expand our operations so we can deliver high quality childcare where it’s needed. It also helps us improve our business model, so we can manage our portfolio and flex and balance our sites to meet changing needs.”

The Benefits

Bright Horizons’ three pillars are ‘people, quality, growth’. Eddie emphasises, “We’re not about just growing for the sake of it. We always want to be where we are needed – where parents can find us and our services will be useful. With this data insight at local level, we can provide a clear picture of community and workplace need to our senior leadership team, so they can sign off new facilities.”

Eddie explains

We have a complex business where everything is audience-centric, so we have multiple offerings. It’s a deeply human business – it’s all about nurturing young children.
The CACI data and dashboard reporting gives us tools to look through every single lens, to understand all the factors that matter to people.

Eddie Thorogood, Marketing Manager, Bright Horizons

Find out more

Please view the full customer story here. If you want to learn more or have any questions please get in touch with us.

It’s all about demand

It’s all about demand

Understanding demand is a key challenge for the water industry as it is a stepping stone in helping solve several puzzles such as distribution, understanding leakage, and helping customers reduce their water use. With some areas of the UK having low meter penetration, and standard meters only being read annually or even less frequently; demographic data is a key aspect in modelling demand to meet these challenges.

Recently, CACI ran a roundtable discussion on all things demand to understand how companies are tackling demand forecasting currently, and what innovations are being explored for the future. We ran the roundtable in conjunction with Anglian Water to share the work they are currently doing in this area, and Badger Meter who were part of the winning team at the recent “Innovate East” Hackathon.

USING DATA TO UNDERSTAND DEMAND – ADAM GRAY, ANGLIAN WATER

Anglian Water is one of the largest geographic water regions, spanning the East of England from Grimsby to Basildon. Unusually, Anglian has a 90% penetration of meters across their region.

One of the biggest challenges currently facing Anglian Water, as one of the driest areas in the UK, is climate change.  The increased risk of drought and predicted reduction in rainfall for the region is a huge concern for the demand of water.

Another major challenge that Anglian is tackling is the continually increasing population growth in the area. Located to the north and east of London, Anglian Water’s region contains 3 of the 5 fastest growing towns in England – Peterborough, Cambridge, and Milton Keynes. This means that in some areas the population could grow by more than 28% by 2045, again causing a huge increase in water demand.

To help tackle these challenges, it’s important to accurately understand the level of demand and therefore be able to calculate and tackle leakage in the area. To do this, Anglian use three main work streams:

  • First, the survey of domestic consumption (SodCon) for which Anglian has 2,000 domestic customers on flow meters, collecting data every 15 minutes. CACI’s geodemographic segmentation Acorn is used to ensure a representative sample of customers have the flow meters.
  • Secondly, for customers that are metered annually, Acorn is applied in conjunction with CACI’s Household Occupancy data to calculate the average daily consumption.
  • Thirdly, Anglian has approximately 17,000 customers on smart meters which collect hourly data. Acorn is applied to this data to again sort them into cohorts to build corresponding models.

The importance of smart meters in an area that is being increasingly challenged in terms of demand cannot be understated. Anglian has a programme in place to get 70% of their customers upgraded to smart meters by 2030, in order to further improve their understanding of how customers use water and plan for future local demand. Acorn will again be used in supporting the build of these models and to help quantify the day-to-day demand in areas that aren’t smart metered.

In addition, the smart meter data is a game-changer in terms of the understanding, modelling and reporting of leakage in a way that Anglian hasn’t been able to do before.

HELPING CUSTOMER SAVE WATER (AND MONEY) – ANNA CRISP, ANGLIAN WATER AND MICHAEL DAVIES, BADGER METER

At the beginning of September, Anglian Water along with Welsh Water and SES Water hosted the event ‘Innovate East’ – a two-week event focussed on innovation in the water industry. As part of the event, a data hack was held to explore what insights and actions could be driven from smart meter data.

The hack had the challenge statement of ‘Helping customers save water (and money)’ and teams were given Anglian’s smart meter data, along with occupancy data and CACI’s Household Acorn data to find innovative ways to approach and answer the challenge.

Using the above statement on the level of water reduction that is being targeted, Michael and the team approached this challenge with the focus on reducing customers waste use of water.

The first step in their approach was to answer the question – what is considered to be ‘excess use’? The team took raw data from a two-person household to look at an average day’s typical water use. From this, they were able to match behaviours to peaks on the graph as can be seen in the image below.

You can see that the activities with high levels of consumption, but low levels of frequency, can be identified as water being wasted and are the activities that are key to target to reduce water use.

By understanding the different ‘excess use’ patterns of different Acorn groups, this information can then be used to create personalised communications to customers to help them better understand their waste habits and to encourage them to consider alternative options. For example, being able to suggest a variable flush to reduce excessive water being used by toilet systems.

The team then proposed an app, ‘Pipedream’, to demonstrate how this would work. Using best practice from the energy industry as a guide, customers would be able to download the app and visualise their daily consumption against a set reduction target. The team also proposed adding options to demonstrate the change in water usage when different activities were chosen. For example, what happens to their water use if they decide to switch to baths instead of showers. This can then link into a reward scheme to encourage users in better water saving habits.

HOW ARE WATER COMPANIES APPROACHING THE CHALLENGE OF DEMAND MODELLING AND INNOVATION?

The roundtables also included discussion from representatives from other water companies sharing their views, examples of best practice and innovative ideas for future approaches to reducing consumption.

Points raised ranged from the importance of understanding the potentially contradictory view that larger households are naturally more water efficient than single person households (and how this can lead to flaws in using Per Capita Consumption (PCC) rather than Per Household Consumption (PHC) in demand calculations), to examples of how quality and timely communications have been proven to reduce water use.

Naturally conversations turned to Covid 19 and the clear evidence of changing behaviours and local demand, and potential ways in which this can be modelled and evidenced.

WHAT’S NEXT?

Look out for our next roundtable in the series which will be focussed on understanding the impact that Covid has had on financial vulnerability in the water sector.

Please do not hesitate to get in touch should you want to hear more!