Navigating Vulnerabilities: The importance of human-centered service design to support better outcomes

Navigating Vulnerabilities: The importance of human-centered service design to support better outcomes

Whilst doom-scrolling on a grey, cold November evening I was shocked to stumble upon a Threads link detailing a user’s experience with a well-known media provider, who, once notified of the user’s mother-in-law passing, sent a one-size-fits-all cancellation email.

Imagine this, a close family member has died, you’re grieving, and rather than the supportive “no worries we’ll cancel everything and make this terrible time less stressful” message, you receive a one-size-fits-all reactivation email using language that is designed to make you miss the service, with one last hope of persuading you to stay. Yeah – Ouch!  

Now, to be clear, there are comments from employees of the company saying that the correct process wasn’t followed.  But really, the customer care agent probably hasn’t even realised the distress they’ve caused doing it wrong and maybe, in their opinion were just trying help get to the end point as quickly as possible – cancelling the service.

What’s even more worrying, is the nearly 700 comments – many of which include similar experiences from substantial organisations who did not provide the expected level of customer care when asked to support with a vulnerable experience we all unfortunately will experience– bereavement.

It seems like a simple thing to resolve, and if you’re a small business that can truly provide 1 to 1 personalised customer experiences, then it probably is. However, this isn’t the case for 99% of the organisations you are likely engaging with.

Think of all the nuances and considerations:

  1. Make it easy to contact you, across different channels depending on preferences
  2. Every single one of your customer-facing agents needs to know, and be aware of, the alternative journey a customer should experience based on vulnerability indicators (and their cumulative effect), to dynamically and effectively help your customer as quickly as possible whilst expressing empath.
  • Your online and offline journeys need to be set up to ensure that information is provided quickly and then all communications (across all departments and sub-brands) are stopped, including removing any chance of inclusion within re-activation campaigns
  • For some sectors, you’ll need to make sure you get the correct fraud checks in place, without causing extra distress

….and many more I haven’t included here.

That sounds like a pretty impossible ask to deliver on, right?

Wrong.

It’s time to look to human-centred service design to support all customer outcomes – especially when they need help. This human-centred service design should then support the cultural, operational, and technological change needed to drive good outcomes.

So, what does this mean? Well, when talking about your customers,  make sure you’re considering them as who they are – a human.

Here are my top 3(ish) pointers to get you started:

  1. Customer segmentation: Yes, personalisation is important. What’s even more important? Applying vulnerability lenses over the top of your segmentation that are easy and simple to ingest. A 30-year old who has lost a parent will have far different expectations, life experiences and support requirements to a 75-year old who has lost their partner, so the impact of this vulnerability indicator will be different to their overall vulnerability requirements (if any).
  2. Ongoing training which is easy to access: Repeated, concise training and processes that empowers employees on exactly what to do in all situations is really important, and this shouldn’t just be  limited to customer facing employees. When you create a customer first culture your customers will feel the difference. Repeat, repeat, repeat. Just look at the recent investigation into Ask for Angela in Manchester and no surprise – those with repeated training (interactive and passive) had great reactions….and those with a one-off training session had no idea what to do. CACI trained 103 bank staff members as part of our vulnerability programme with Handeslsbanken on customer centred design and engaged across all tiers of banks management, departments, teams and  projects. This was just to kick off their customer-centric ethos.
  3. Once you have joined up systems – place customers (especially vulnerable customers) at the heart: You’ve resolved identities, you’ve trained up the business, you’ve created customer journeys – now it is time to actually make sure that the customer is at the heart of your systems based on how they’ll interact with you as a brand.  If a customer has been flagged as vulnerable (e.g. for bereavement) and they contacted the contact centre to inform them, this should be reflected in all versions viewed of that customer record. This means if they go into a branch the following week, the data the branch staff can see flags that they’re vulnerable so they can tailor their communication and are more sensitive and empathic. If there are separate customer care and billing/collections team – make sure billing/collections can see that the customer is vulnerable and consider different communications when chasing payments.

Feeling stumped?

CACI can run vulnerability audits on your systems and journeys to help you get an independent eye into your process and where you can make the biggest impact. Get in touch today and I’ll walk you through next steps.

And remember…. vulnerability indicators include challenging life events such as bereavement (temporary vulnerability) as well as life-long indicators such as accessibility. The FCA outlines four drives of vulnerability which is a pretty good benchmark for all sectors:

  • Health, for example physical, sensory or cognitive impairments or illness
  • Life events, for example bereavement, relationship breakdown or job loss
  • Resilience, or the ability to cope with new or difficult financial or emotional situations
  • Capability, or differences in understanding or confidence when making financial decisions

If you are interested in learning more around service-design then read: Applying the lens of vulnerability to design – part 2 or contact us.

Challenging areas for the grey belt: London and the South West

Challenging areas for the grey belt: London and the South West

In this final article in our grey belt series combining CACI’s housing demand data with VirginLand’s grey belt site identification, we take a deeper dive into two areas where the impact of the grey belt will be less obvious: London and the South West.

This is not to diminish the overall value of the initiative, but to point out that it is not the single answer to the UK’s housing challenges. To be most effective, grey belt reallocation should be considered alongside other mechanisms to accelerate housing delivery such as brownfield, infill, repurposing and urban regeneration.

How will the grey belt initiative affect London?

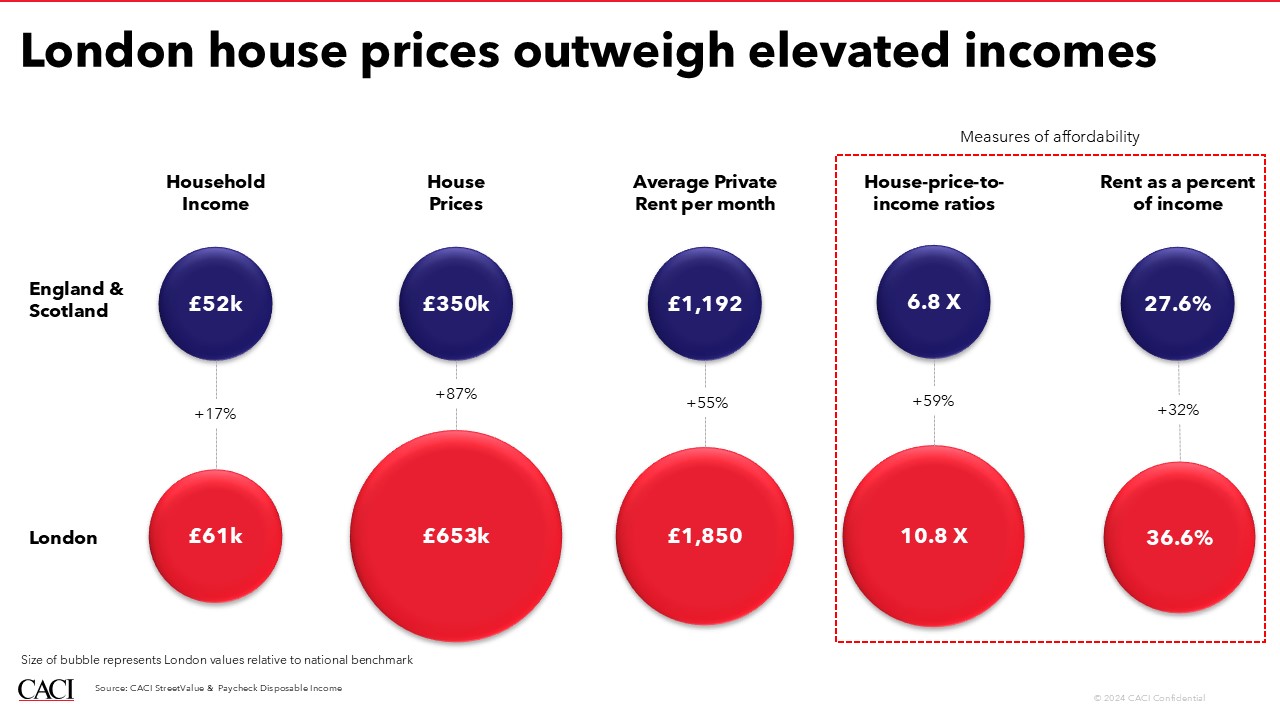
Home to over 7 million adults, London is by far the most densely populated region in the UK. As a result, demand for housing is particularly acute in the capital and the conversation is dominated by affordability. It’s easy to see why; house prices are 11 times the average household income, and private rent is 37% of income. Although households in London earn 17% more than the national average, these high prices mean that homes are 59% less affordable to buy and 32% less affordable to rent.

In this context, any initiative to increase the overall supply of housing in this region is welcome; particularly if it’s targeted at the more affordable end of the scale. So, what impact will the grey belt have in London?

Although home to 14% of the population, London can house just 0.4% of all grey belt homes – a total of 1,955 dwellings across 31 sites. This is not for want of green belt (22% of the London region, by area, is currently designated as green belt), but for want of suitable locations that could be re-designated. Analysis by VirginLand shows that just 0.2% of the available green belt land is likely to be reallocated grey belt, with much of the London’s green belt holding additional designations like Designated Open Space, Country Park, Woodland or Nature Reserve and Conservation Area and Grade 1-3b agricultural land grades.

The challenge in London is also compounded by the location of the sites relative to movers. Being on the outskirts of the urban sprawl, just 11% of all London home movers live within the catchment of the identified sites; roughly 192,000 individuals. Although more than enough to absorb any new homes delivered, the scale of movers puts into perspective how limited the impact would be on demand; if all sites were built out to their fullest, there would be 98 movers for each home.

While there is little doubt that the 31 identified locations would be additive to the overall housing stock, the question is over how much of an impact these limited sites can have on a particularly strained market. With the population set to grow by another 6.1% in the next 10 years, London will need other initiatives, alongside the grey belt, to accelerate housing delivery in more urban neighbourhoods.

How will the grey belt initiative affect the South West?

Just 4.5% of the South West is designated as green belt, well below the national average. It therefore follows that grey belt opportunities in the South West will be similarly limited, and just 228 potential sites have been identified with the combined potential to deliver 11,868 new homes.

While this is not an insignificant number of homes, it represents just 2.2% of the total grey belt opportunity spread across 9.4% of the population. The location of grey belt sites also limits the initiative’s regional impact, as just 18% of the 1.6 million potential South West movers live within the grey belt catchment, against a national average of 36%.

Although limited in scope for the region as a whole, there are some pockets where the grey belt will be more impactful, and the characteristics of the catchment movers in these locations point to the type of homes that should be prioritised.

With concentrations of sites close to urban populations in the likes of Bristol, house-to-earning ratios and rent-to-earning within the grey belt catchment are higher than those outside of it (7.1 times income and 27.4% of income respectively). High concentrations of Family Renters, Tenant Living and Cash-Strapped Families within this catchment, and relatively large sites averaging 1.7 hectares, suggest a particular opportunity to deliver larger mixed neighbourhoods with high levels of rental product.

As with London, the grey belt initiative has the potential to support some of the housing needs of the South West, but an overarching housing strategy for the region should also be mindful of the 82% of home movers that live outside of the grey belt catchment.

How CACI can help?

To learn more about how you can ensure that your developments are meeting the demands of local movers, contact CACI.

Missed the previous blogs? Find the links to the series so far below:

How grey belt sites will help tackle the UK housing crisis – CACITolga Necar

Grey belt sites: what they are, locations & impact on housing – CACI  Steve Norman and Sam Bedford,  Virgin Land

Assessing the impact of the grey belt initiative on a National scale – CACITolga Necar

How will the grey belt initiative affect North West England & Scotland? – CACI – Tolga Necar

Grey belt sites: what they are, locations & impact on housing

Grey belt sites: what they are, locations & impact on housing

In the previous blog within this series, CACI assessed the current state of the UK’s house building targets and how grey belt sites can lead to improved outcomes. Today, Virgin Land will dive deeper into what these grey belt sites are, including their locations and projected impact on the future of housing.  

 Grey belt sites explained: freeing land for homes

The UK’s ongoing housing crisis has left politicians and planners scrambling for solutions. To address the shortfall, the new Labour government has introduced a fresh approach: grey belt sites. But what exactly does this mean, and how might it help? 

“Grey belt” refers to parts of the green belt that the government believes can be reclassified for development. These areas, while part of the green belt, make limited contributions to the five core purposes of the green belt, like safeguarding the countryside or stopping towns from merging together. Since they no longer offer much in the way of environmental or spatial benefits, they could now be considered for development under new rules. The grey belt typically consists of previously developed land or parcels with minimal environmental or historical significance. By shifting these areas from green belt protection to grey belt status, the government hopes to balance the need for housing with environmental sustainability. In practice, grey belt sites include land that may have been industrially or commercially used in the past, or areas close to urban centres that are no longer agriculturally productive. These sites provide a critical opportunity to deliver housing where it’s most needed, particularly in regions where development has stagnated due to green belt restrictions. 

How many grey belt sites exist & where are they located?

At VirginLand, we’ve conducted an extensive study and found around 14,000 possible Grey Belt sites across England and Scotland, covering about 17,500 hectares. That’s just over 1% of all Green Belt land in the country, underscoring the selective nature of this reclassification. Most Grey Belt land can be found in older industrial towns, particularly in the Northwest and Midlands, where a whopping 64% of people in the Northwest live within two miles of a potential site (the national average is 38%). In future blog posts, we’ll take a closer look at the regions across the UK.

How could grey belt sites impact housing?

Reclassifying land as Grey Belt opens up a significant opportunity for housing development, especially in regions where supply has consistently failed to meet demand. Based on current estimates, if development were to proceed at an average density of 30 dwellings per hectare, the identified Grey Belt sites could accommodate around 525,000 new homes. If densities were to increase to 35 or 40 dwellings per hectare, the number could rise to 610,000 or even 700,000 homes. But even with this potential, the government still wants to focus on brownfield first approach before using any Grey Belt land. Local Planning Authorities (LPAs) are required to prioritise brownfield sites before considering greenfield or grey belt areas for development.

Future predictions of housing through grey belt sites

The grey belt idea is a big shift in how we think about land use, potentially opening up vast amounts of space for new housing. It’s especially promising for regions like the Northwest and Midlands, where building has been difficult in the past due to green belt restrictions. However, this isn’t a magic fix—some areas like London and the Southeast still face substantial challenges when it comes to housing. Making the most of grey belt land will take careful planning and input from the public to ensure that the right balance is struck. This new approach could help ease the housing crisis, but only if it’s rolled out thoughtfully. 

How Virgin Land and CACI help?

To find out more about ensuring your developments meet the demands of local movers, contact CACI and they will be touch.

* This insightful blog has been authored by Steve Norman and Sam Bedford from Virgin Land.

How grey belt sites will help tackle the UK housing crisis

How grey belt sites will help tackle the UK housing crisis

The UK has not been meeting its house building targets for some time. This is not new news, but it is worth reiterating the scale of shortfall. Over the past five years, we have consistently delivered 20% fewer homes than were targeted: a total miss of nearly 300,000 homes (or put another way, an entire year’s target). 

Couple this with projected population growth and we can see why house building has made its way up the political agenda. The population is expected to swell by 3.8 million people over the coming 10 years, and naturally, these people will need somewhere to live.  

In this blog series, CACI and Virgin Land will uncover key questions around the future of house building targets and how they can be addressed via grey belt sites, including their locations and desirability, whether they create suitable opportunities for inhabitants and how they vary by region.

Where should new house building targets be focused?

Population growth will concentrate around major towns and cities, especially given that 14 of the largest 15 towns and cities have projected growth rates that outstrip the UK average. However, cities are not always where the market has delivered new homes. In fact, eight of those top 15 towns and cities have housing delivery rates that lag behind the national average. Therefore, new housing targets should be geographically directed to the places that people want to live. 

Who should be the focus of house building targets?

Housing growth should be targeted at the people that need it most. Left to its own devices, the market has delivered new housing that concentrates around a few demographic groups. Using CACI’s Acorn segmentation to profile new homes delivered in the last five years, we can see clear trends in the data; Tenant Living (young, urban renters) comprise 18% of new homes but just 12% of the population, Semi-Rural Maturity and Mature Success (two affluent, older groups who are likely to be downsizing) collectively account for 20% of new homes but just 13% of the population. Lower affluent, urban families such as Limited Budgets, Hard-Up Households and Cash Strapped Families, however, have received disproportionately little housing development.  

This is not to lay blame on housebuilders; the commercial challenges of development in urban environments are clearly contributing factors, however, the impact is one of acute supply challenges in specific demographic groups who are coincidentally the groups most likely to be living in over-occupied housing. To maximise the impact of housebuilding initiatives, the route forward requires a more collaborative approach, which the newly formed MADE Partnership may well deliver. 

How will the grey belt make a difference for house building targets?

Central to the Labour government’s housing policy is the rezoning of poor-quality green belt sites into the “grey belt”, effectively opening swathes of previously unavailable land for development. But how influential could this policy change be? CACI and Virgin Land have partnered to uncover the potential impact that opening up the grey belt can have on housing market dynamics.  

How CACI can help? 

Stay tuned for the next blog in this series, where we’ll dive deeper into grey belts, their locations and their impact on housing. In the meantime, contact CACI to learn more about how you can ensure that your developments are meeting the demands of local movers.

Why retail destinations should invest in consumer experiences & perceptions

Why retail destinations should invest in consumer experiences & perceptions


Want to increase your visitors’ spend by 25%? Invest in your amenities.

Facilities are a vital part of retail and leisure destinations. Despite not directly producing turnover, they play an essential part in driving performance. Through research from our Shoppers Dimensions dataset– our database of over 1 million respondents across 270 UK-wide destinations which enables key performance indicator (KPI) benchmarking of assets against similar locations across the UK to contextualise performance and enhance decision-making– we analysed how various KPIs are impacted by consumers’ experiences and perceptions.

So, how exactly are services and amenities within retail destinations affecting consumers’ behaviours? How can retail destinations leverage these insights to bolster experiences and perceptions?

How do consumers’ overall shopping experiences influence their spending behaviours?

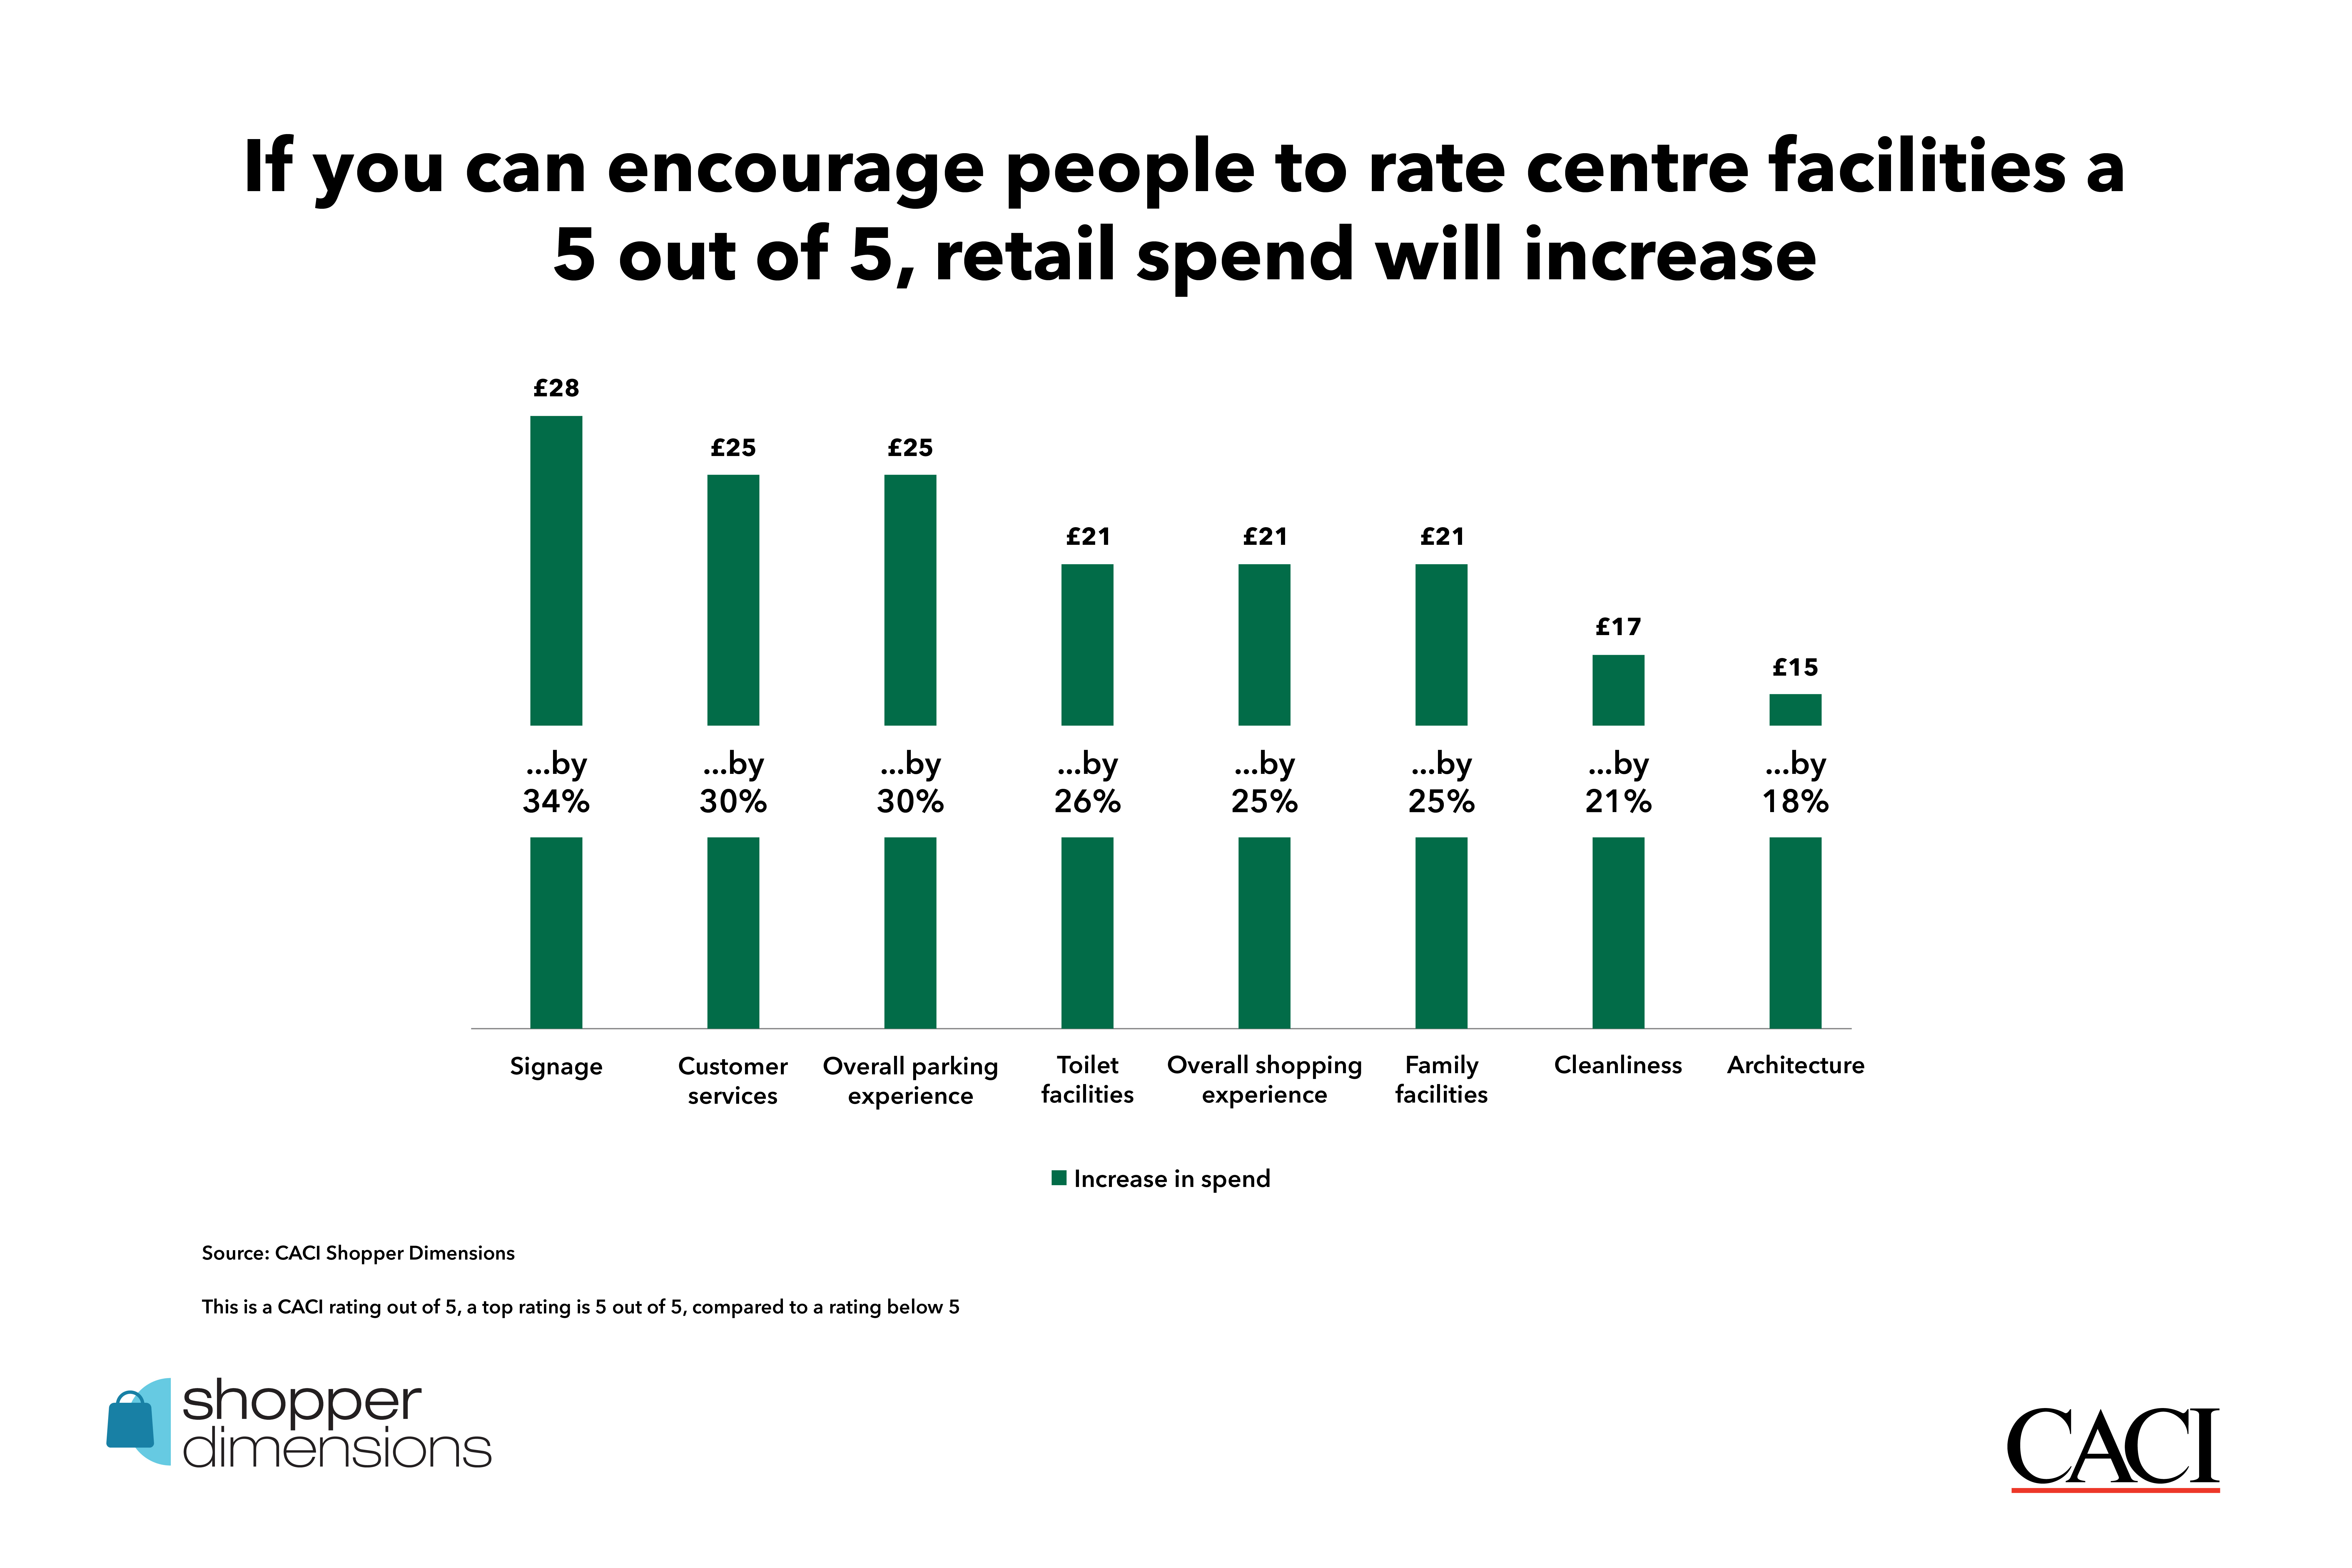
According to our research, retail destinations capable of improving their rating of a person’s overall shopping experience may recognise an increase in their average retail spend by £21. There is an uplift across the board when overall shopping experience is rated 5 out of 5, with average retail spend increasing by 25% and catering spend by 17%.

How do experiences & perceptions of toilets impact retail destinations?

It may not be a glamourous topic, but toilets are often called out by customers as an issue. They are expensive to renovate and maintain, and without a direct revenue stream associated with them, it is easy to think of toilets as a cost. Despite this, our data shows that investing in facilities can actually drive performance.

Firstly, when looking at shopping centre locations of those that rate the toilet facilities 5 out of 5, our data shows that this leads to an uplift in time that a person stays at the destination by 16%, which accounts for 12 additional minutes per customer. But how does this additional dwell time translate into spend? Customers that give toilets a top rating record a 26% uplift on their average retail spend, an increase of approximately £21.34 per customer.

Retail is not the only category affected. In fact, catering conversion experiences an uplift of 5 percentage points and the average spend on catering increases by 19%. There is therefore direct value to unlock by maintaining and improving these facilities, even if that means you have to spend a few pennies to do so.

How to attract more family groups from further afield 

Family groups can be a hard group to target, but once at the destination, they are likely to come for ‘Big Day Out’ trips which are associated with a higher average spend. For many destinations, this group tends to live further afield, such as in the suburbs of a city. When family facilities are rated higher, there is an uplift in their drivetime by 23%, an increase in their dwell time by 17% along with an uplift of 25% in  associated retail spend. Showing that better family facilities draw in these high-spending visitors from further away

How do car park experiences & perceptions impact interactions with the rest of the shopping centre?

One of the most interesting findings we came across when looking into the impact of ratings was with overall parking experience. This is another topic that consumers are passionate about; ever hard-to-please, the consumer wants it to be cheaper, with more spaces and of a better quality. But do better perceptions really lead to stronger key performance metrics? In short, the answer is a resounding “yes”. Those who rate the overall parking experience 5 out of 5 see an uplift in dwell, retail and catering average spend and conversion. The greatest uplifts are in dwell time and average retail spend. On average, dwell time will see an uplift of 17% (14 minutes) while average retail spend will see an uplift of 30%, leading to an average increase in spend of just over £25.

Key takeaway: higher perceptions equal higher spend

Overall, our data shows that the higher the perceptions, the more people will spend and the longer they will stay. This is the case when we look at the ratings for overall shopping experience, cleanliness, overall parking experience, family facilities, customer services, signage, architecture and toilet facilities. While it might not be glamourous, strong perceptions of parking experience and toilet facilities do lead to an increase in key performance indicators, proving that there is value to be unlocked by investing in these facilities.

How can CACI help?

At CACI, we understand the impact that driving improved perceptions of facilities within a retail destination can have on consumers’ behaviours, such as which amenities encourage people to visit from further away, stay longer or spend more on their trip. To gain a better understanding of how consumers interact with places, reach out to us to discuss how we can help you measure your performance and identify growth opportunities

Most impactful food-to-go transaction trends into 2024

Most impactful food-to-go transaction trends into 2024

With the continuing trend of hybrid work within worker hubs, consumers’ food-to-go spending in quick service restaurants (QSRs) remains concentrated on some days and displaced on others. Consumers’ wallets also continue to face an ongoing squeeze, resulting in pressures on day-to-day convenience spend.  

So, what transactional trends are being observed across different demographic groups, geographies and price-points as these trends continue? What impact do these trends have on operators’ future openings strategies and overall performance? 

Food & beverage have become increasingly prominent on High Streets 

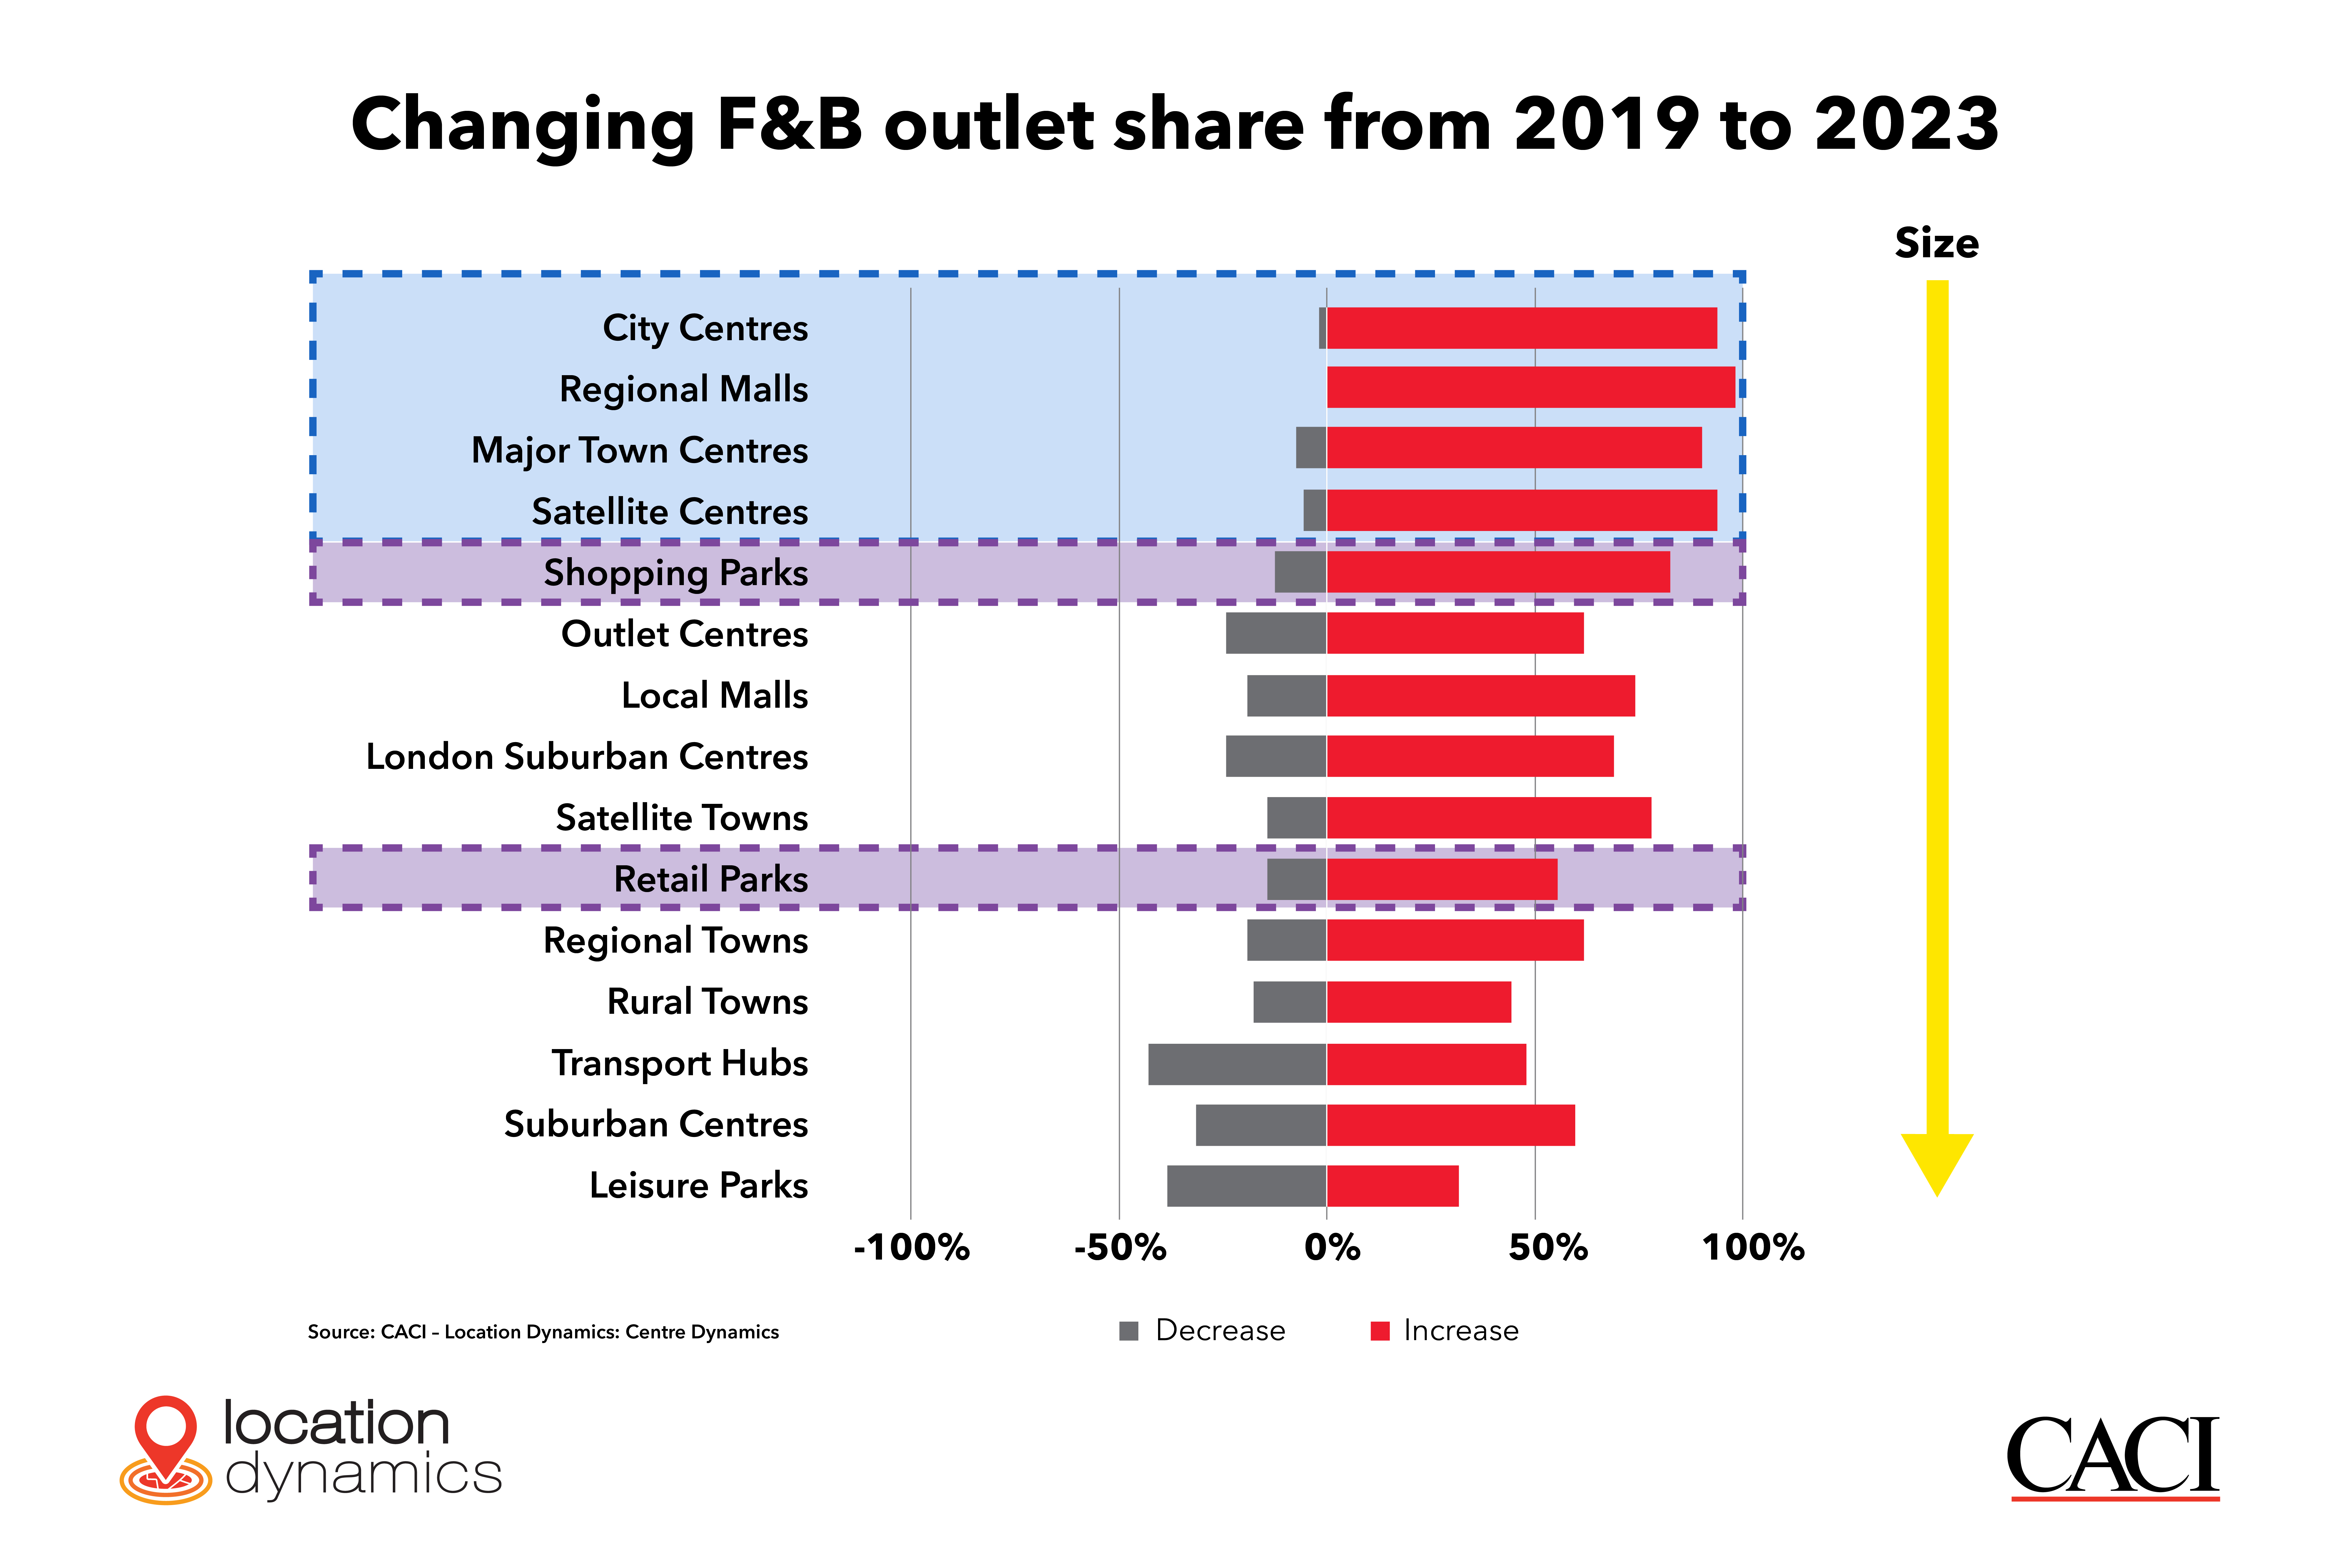
Over the course of 2019 to 2023, most retail centres in all asset classes have grown their share of food and beverage (F&B) outlets, noting an increase in over 90% of centres in the top four classes— City Centres, Regional Malls, Major Town Centres and Satellite Centres. Despite F&B having become increasingly prominent in shopping and retail parks, there has been a mixture of increases and decreases observed in towns, transport hubs and leisure parks, raising the question of whether oversaturation has had a role to play in some locations.

Centres are polarising

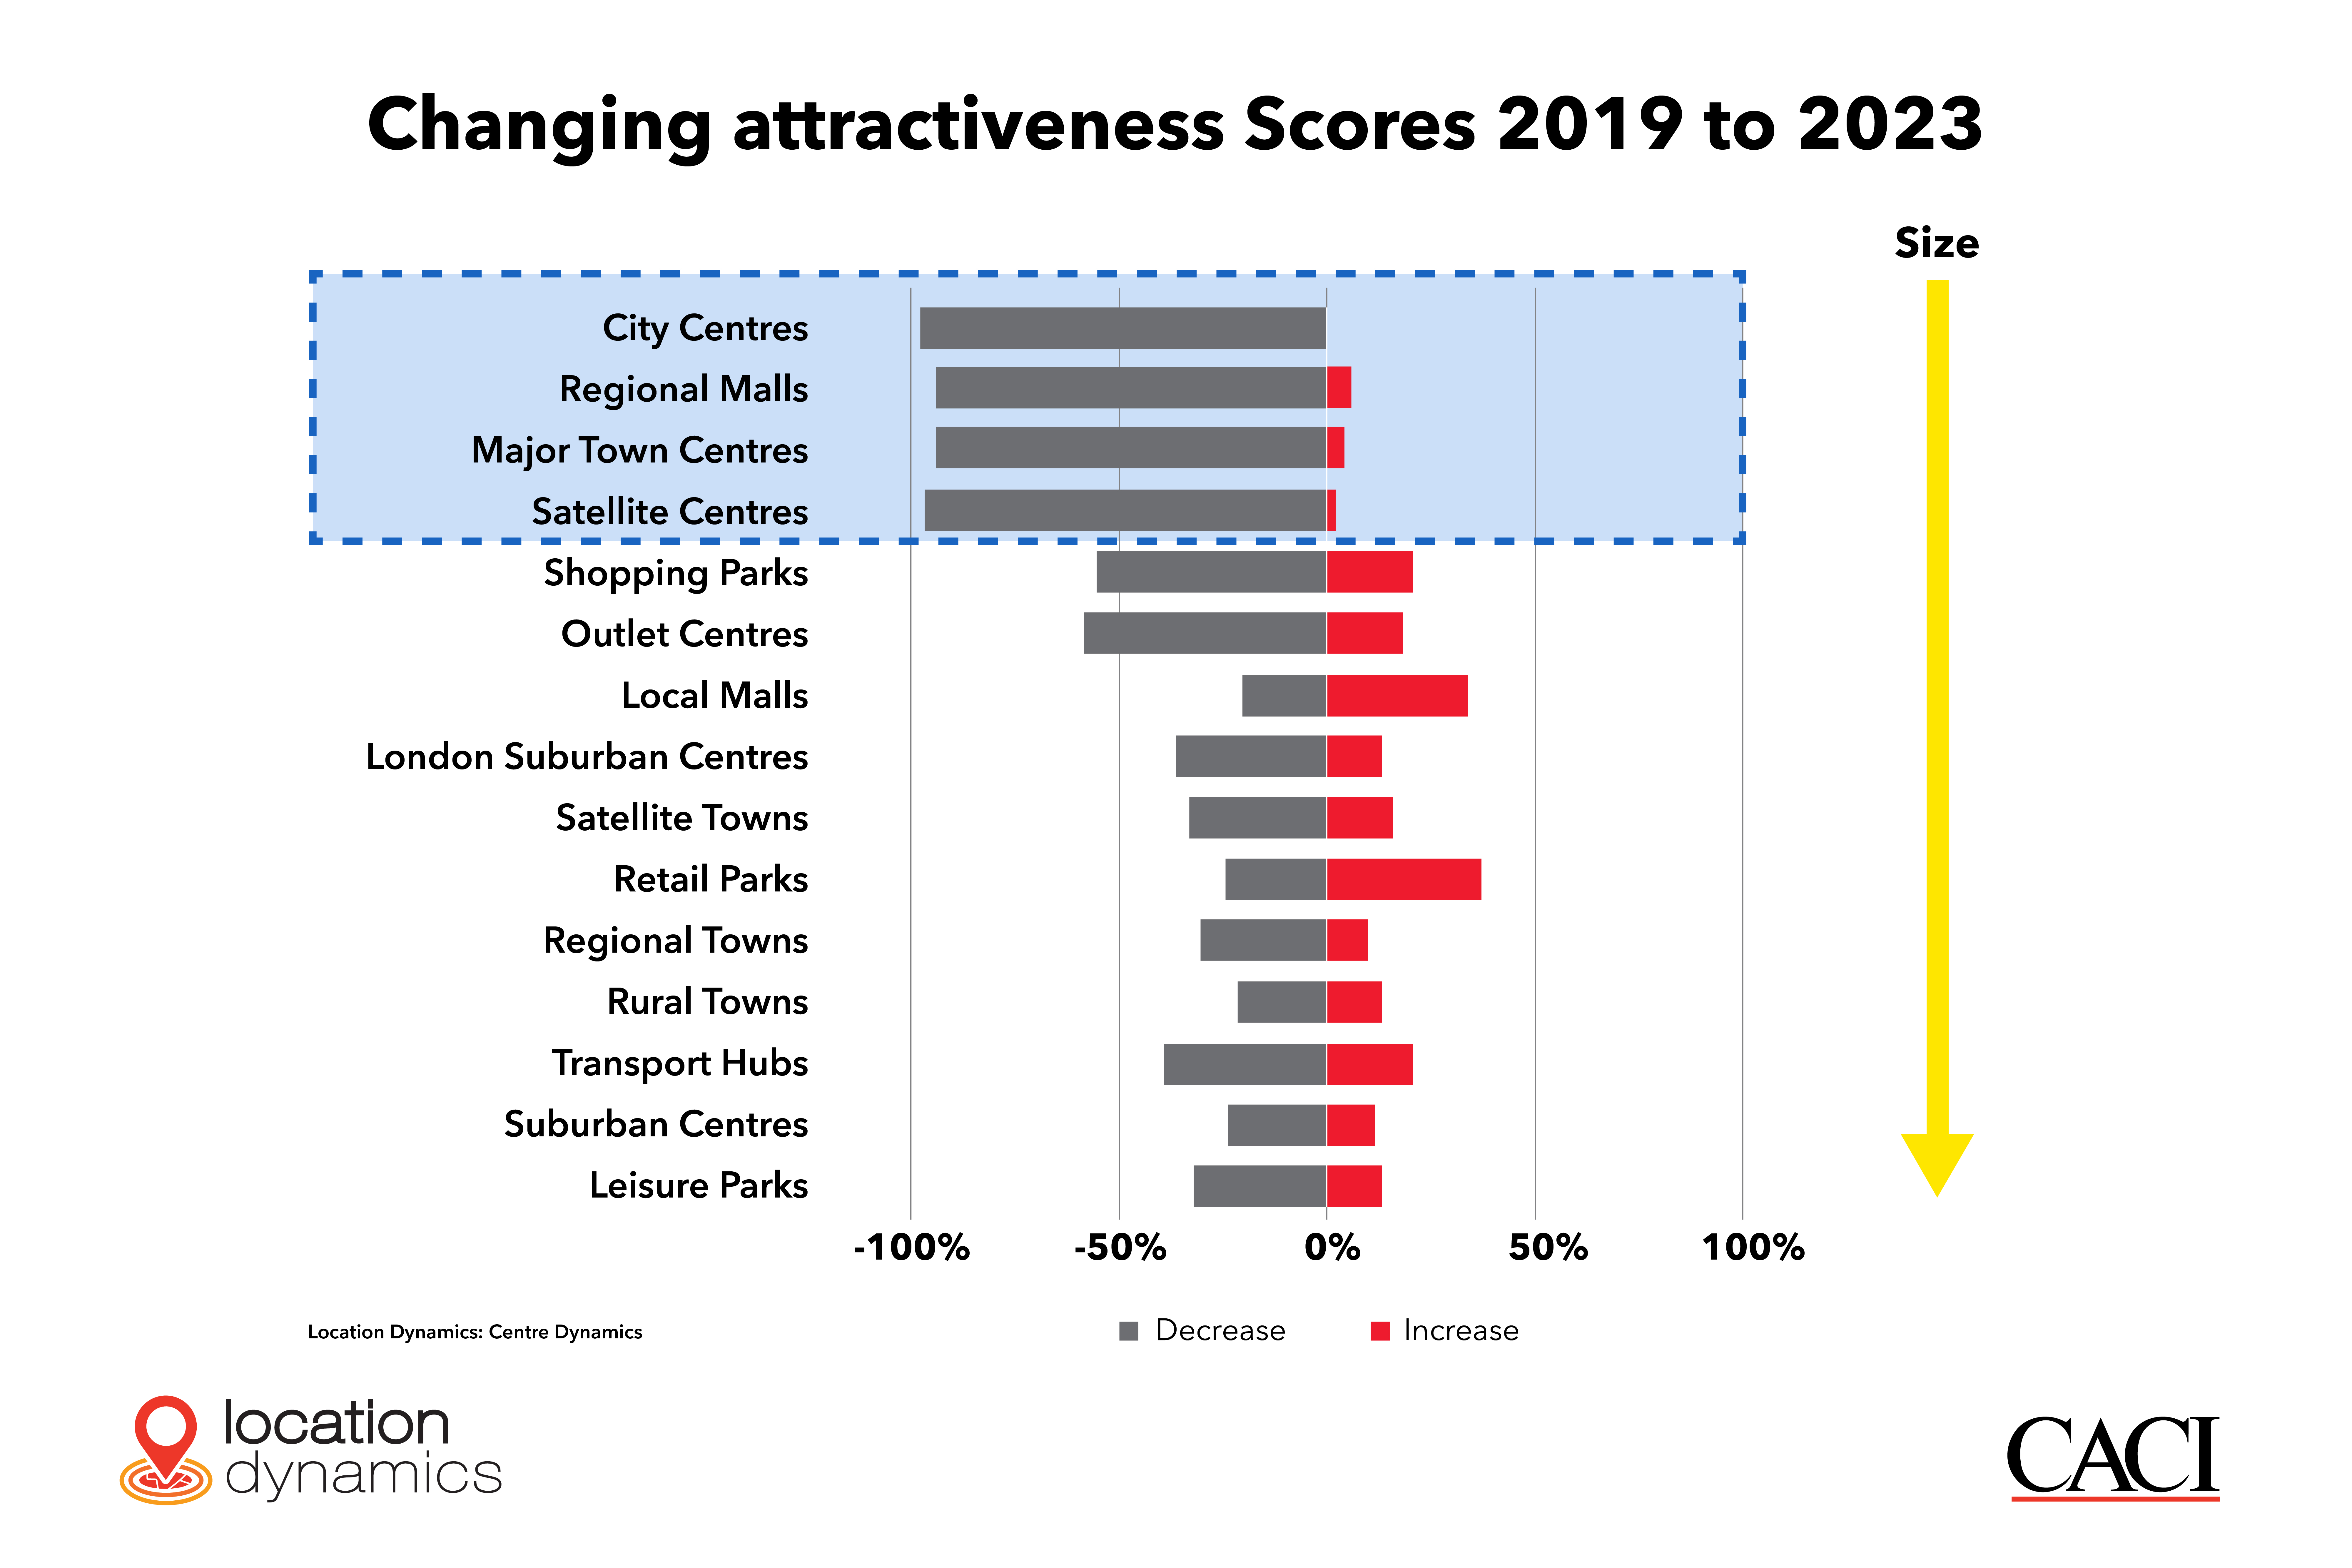
Over the same time period, city centres, regional malls, major towns centres and satellite centres have dropped in their overall level of consumer attractiveness in line with consumers’ changing behaviours. So much so, that the four largest asset classes have seen declines in over 90% of their centres. The picture is a bit more mixed as the retail hierarchy descends into towns, transport hubs and leisure parks, however, with an average of 40% of centres in these asset classes seeing a decline. The ever-increasing proportion of consumer spend moving online has undoubtedly prompted these downward trends.

Given the vast differences in changes at an asset class level, and with many exceptions at a centre level, having access to detailed data on the changing attractiveness and demographics at centre level is vital. 

Customer behaviours towards QSRs continue to change

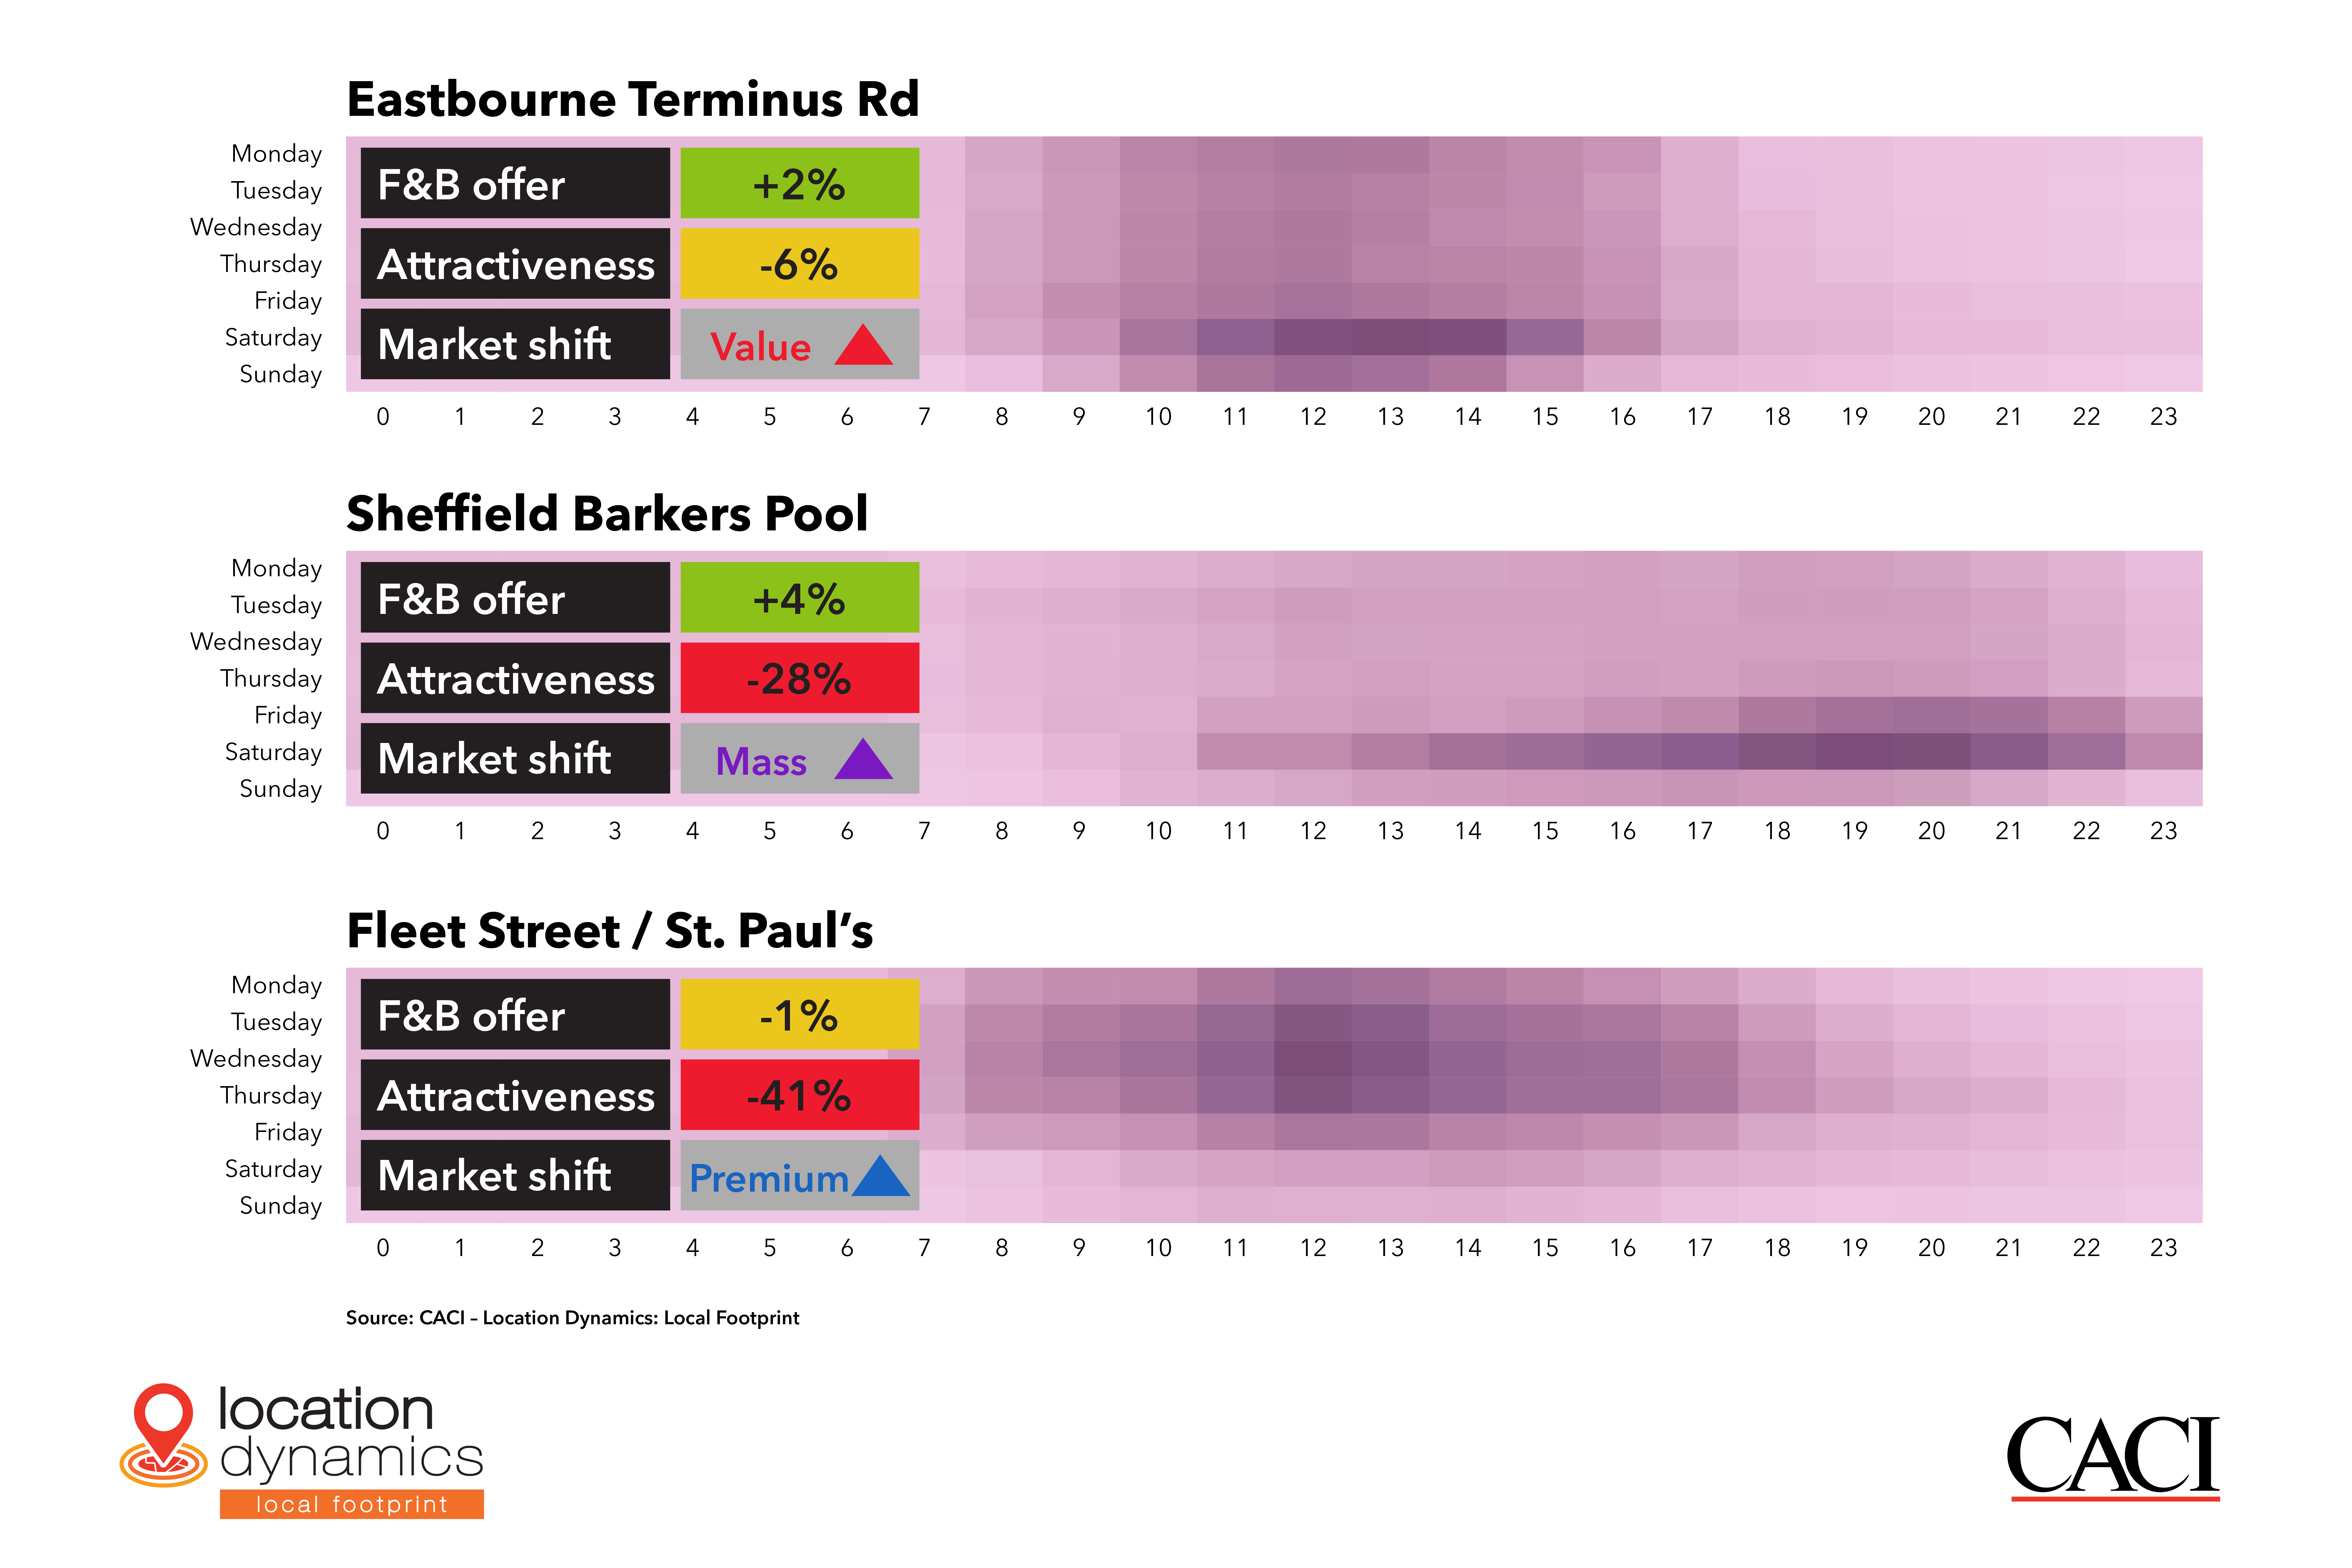
Many may think that post-Covid QSR demand is just about Tuesday to Thursday, driven by changes in working behaviour, but this is an over-simplification. CACI’s local centre mobile app data analysis within our Location Dynamics suite shows that while areas like Fleet Street/St. Paul’s in the City of London now do have a pronounced Tuesday to Thursday peak, it’s far from the universal norm. As shown by the dark-shaded time segments in the graphs below, places like Barkers Pool in central Sheffield have a very pronounced Friday and Saturday night economy. This further contrasts with central Eastbourne, which has maintained a more traditional Monday to Sunday 9 a.m. to 4 p.m. custom and a strong weekend daytime custom.  

Ultimately, locations are different, and successful operators must understand the different ‘missions’ their customers will be on to ensure they meet their customers’ needs and ensure that they staff their outlets to provide the right level of services at times demanded by their customers.

For food-to-go retailers to engage with consumers at the right time and in the right place, it will be critical for them to consider:  

  • The F&B offers in local areas 
  • Changing consumer behaviours as a reflection of new and embedded worker patterns, 
  • Centre attractiveness 
  • Overarching market shifts that impact footfall on specific days and times.  

How CACI can help?

With these trends in mind, it is critical for food-to-go retailers to have a detailed understanding of who their customers are, where they are located and what times of the week they are most likely to interact with your chain or restaurant. It is equally important to understand your place in terms of its attractiveness to customers and the effect of its location on driving footfall.  

Data is key to maintaining a competitive edge amidst evolving trends, an area where CACI excels in providing support. Find out how we can keep you and your team ahead of the curve by reaching out to us today.

Most impactful holiday and air travel trends for 2024

Most impactful holiday and air travel trends for 2024

If the last few years of pandemic uncertainty and budget constraints amidst the ongoing cost of living crisis have shown us anything, it’s that travellers have become increasingly conscious of the cost of travel. As a result, they’ve placed increased value on having an optimal travel experience to justify its cost.  

We examined the current driving factors behind optimised travel experiences in our Voice of the Nation Q1 2024 survey, where we asked 2,000 respondents how they felt about an array of travel changes and how the cost of living, airline loyalty and more have impacted their travel choices into 2024. 

So, what shared values and needs do travellers of all ages and affluence levels seem to have in common this year? How have these forthcoming trends been affecting the wider travel industry?

Travel spend will increase in 2024 despite decreases in most other sectors

When asked whether their anticipated spending will decrease, increase or stay the same this year compared to last, holidays actually rank third among areas people expect to increase spend in 2024– with groceries and commuting costs coming in first and second– despite an overall expected decrease in spend in other areas this year.  

Plans to holiday abroad skew significantly on affluence lines 

From Boomers to Gen Z, more than half of respondents from every age group plan to holiday in some capacity– both in the UK or abroad– in 2024.  

When it comes to taking holidays abroad, 38% of respondents are making plans and budget room to do so this year. Of these respondents, as much as 50% come from the higher affluence Acorn categories of Established Affluence and Thriving Neighbourhoods. Approximately one in three of the lower affluence categories of Steadfast Communities, Stretched Society and Low Income Living share the same sentiment.  

A quarter of all respondents have no intention of travelling this year, and 22% plan to visit another part of the UK, which would appear to be in an effort to save on travel spending. In reality, no matter where you go for your next holiday, the same proportion of respondents agree that cost will be the biggest determinant behind their destination. 36% of those staying in the UK say that they will go on holiday within the UK because they prefer it to going abroad, showing that while cutting travel costs is a major driver, it is not necessarily the only one.  

Half of respondents claim no loyalty to an airline

When asked what the contributing factors towards airline loyalty are, half responded that they have no loyalty to any airlines.  

Roughly one-third (31%) of those who are loyal towards an airline felt that their loyalty is driven by more than one factor, such as convenience, discounts and luggage/check-in benefits. In comparison, 18% felt there was only a singular driving factor behind their airline loyalty, showing that where loyalty is in play, it is usually multi-factorial. 

Convenience is the most significant driver behind airline choices

Apart from price, respondents’ most significant contributing factors towards airline choices when booking trips came down to flight times and route, both of which are also the only factors heavily skewed by affluence. Nearly 60% of the Established Affluence and Thriving Neighbourhoods category respondents reported this to be significant, compared to just 35% among Low Income Living. Gen Z, however, scored this even lower, with just 32% finding this to be significant and instead placing more emphasis on the ease of booking at 37%. 

Families are much more affected by cost this year

In terms of holiday planning this year, one-third of respondents said that they wanted to keep their holiday costs as low as possible to maximise value for money and felt that costs would be the greatest determinant of where they holiday in 2024. Among those with children, 40% said that cost is the biggest determinant of where they go on holiday. 

Sustainable transport options appeal much more to Gen Z

Of all demographics, Gen Z appear to be the most motivated by sustainability when planning their holidays, both in terms of those taking immediate action but also those who would like to travel but feel unable to presently. In fact, 18% of Gen Z respondents said that they will be cutting down on air travel in 2024 due to their growing environmental concerns, compared to just 8% among the rest of the population. 

How CACI can help?  

As the travel industry evolves with travellers’ changing sentiments, holiday and air travel operators must be equipped with the necessary understanding of who their customers are, what their motivations for travel are, what they seek from their travel experiences and how to deliver optimal experiences that will drive loyalty. Data is integral to this, which is where CACI excels in providing support.  

To find out how we can keep you and your team amidst turbulent times, get in touch with us today.

Impact of turnover vs. footfall for shopping destinations in 2024

Impact of turnover vs. footfall for shopping destinations in 2024

Footfall has historically been the go-to method for measuring a shopping destination’s performance, conducted through pressure sensor mats, light sensors tracking shoppers’ entry and exit movements, advanced camera systems and more. Although ubiquitous across the retail industry, only measuring the number of people entering and exiting a store misses important aspects of true store performanceThe current pace of change in consumer behaviors demands that commercial landlords and occupiers know more about their performance drivers if they are going to thrive.

So, why is this the case? What do commercial landlords need to know about turnover and footfall to stay afloat?

How consumers’ changing behaviours towards shopping locations affect footfall

Since 2019, vendors across the UK have experienced an overall 11.5% drop in footfall. While this may sound like catastrophic news for retail destinations, the truth behind the headline footfall figures is perhaps surprising– an overall rise in consumer spending. Although a shift in consumers’ shopping behaviours is undeniably present, its impact may not be as profound as it seems.

Frequency has been a major driver of this, dropping by 31% over the last five years, meaning that consumers have been visiting shopping places much less often. However, the amount being spent by consumers when visiting shopping locations has climbed 29% over the last five years, counteracting declining footfall. 

This increase in trip spending is not just an inflationary rise – the fundamental reason to visit and our behaviours on visits have changed as a result. Successful locations are those that are adapting to the new shopper landscape.  

How consumers’ changing spending habits, values & “missions” affect footfall

What consumers are spending any disposable income on has also been changing. While retail conversion has remained relatively unchanged, there have been evident increases in Catering and Leisure conversions on the same trips, meaning consumers are increasingly combining a shopping trip with food/drink or a leisure activity. It is this combination of shopping, browsing, eating/drinking and leisure that has led to the overall increase in spending per trip.  

These comparisons can be illustrated through what we at CACI call “missions” from our Shopper Dimensions dataset, which illustrate the trip someone is on at a given time, and attribute “missions” to the tangible actions someone takes once at the shopping destination, such as browsing, spending, time spent, etc., to assign a “mission” to each trip.  

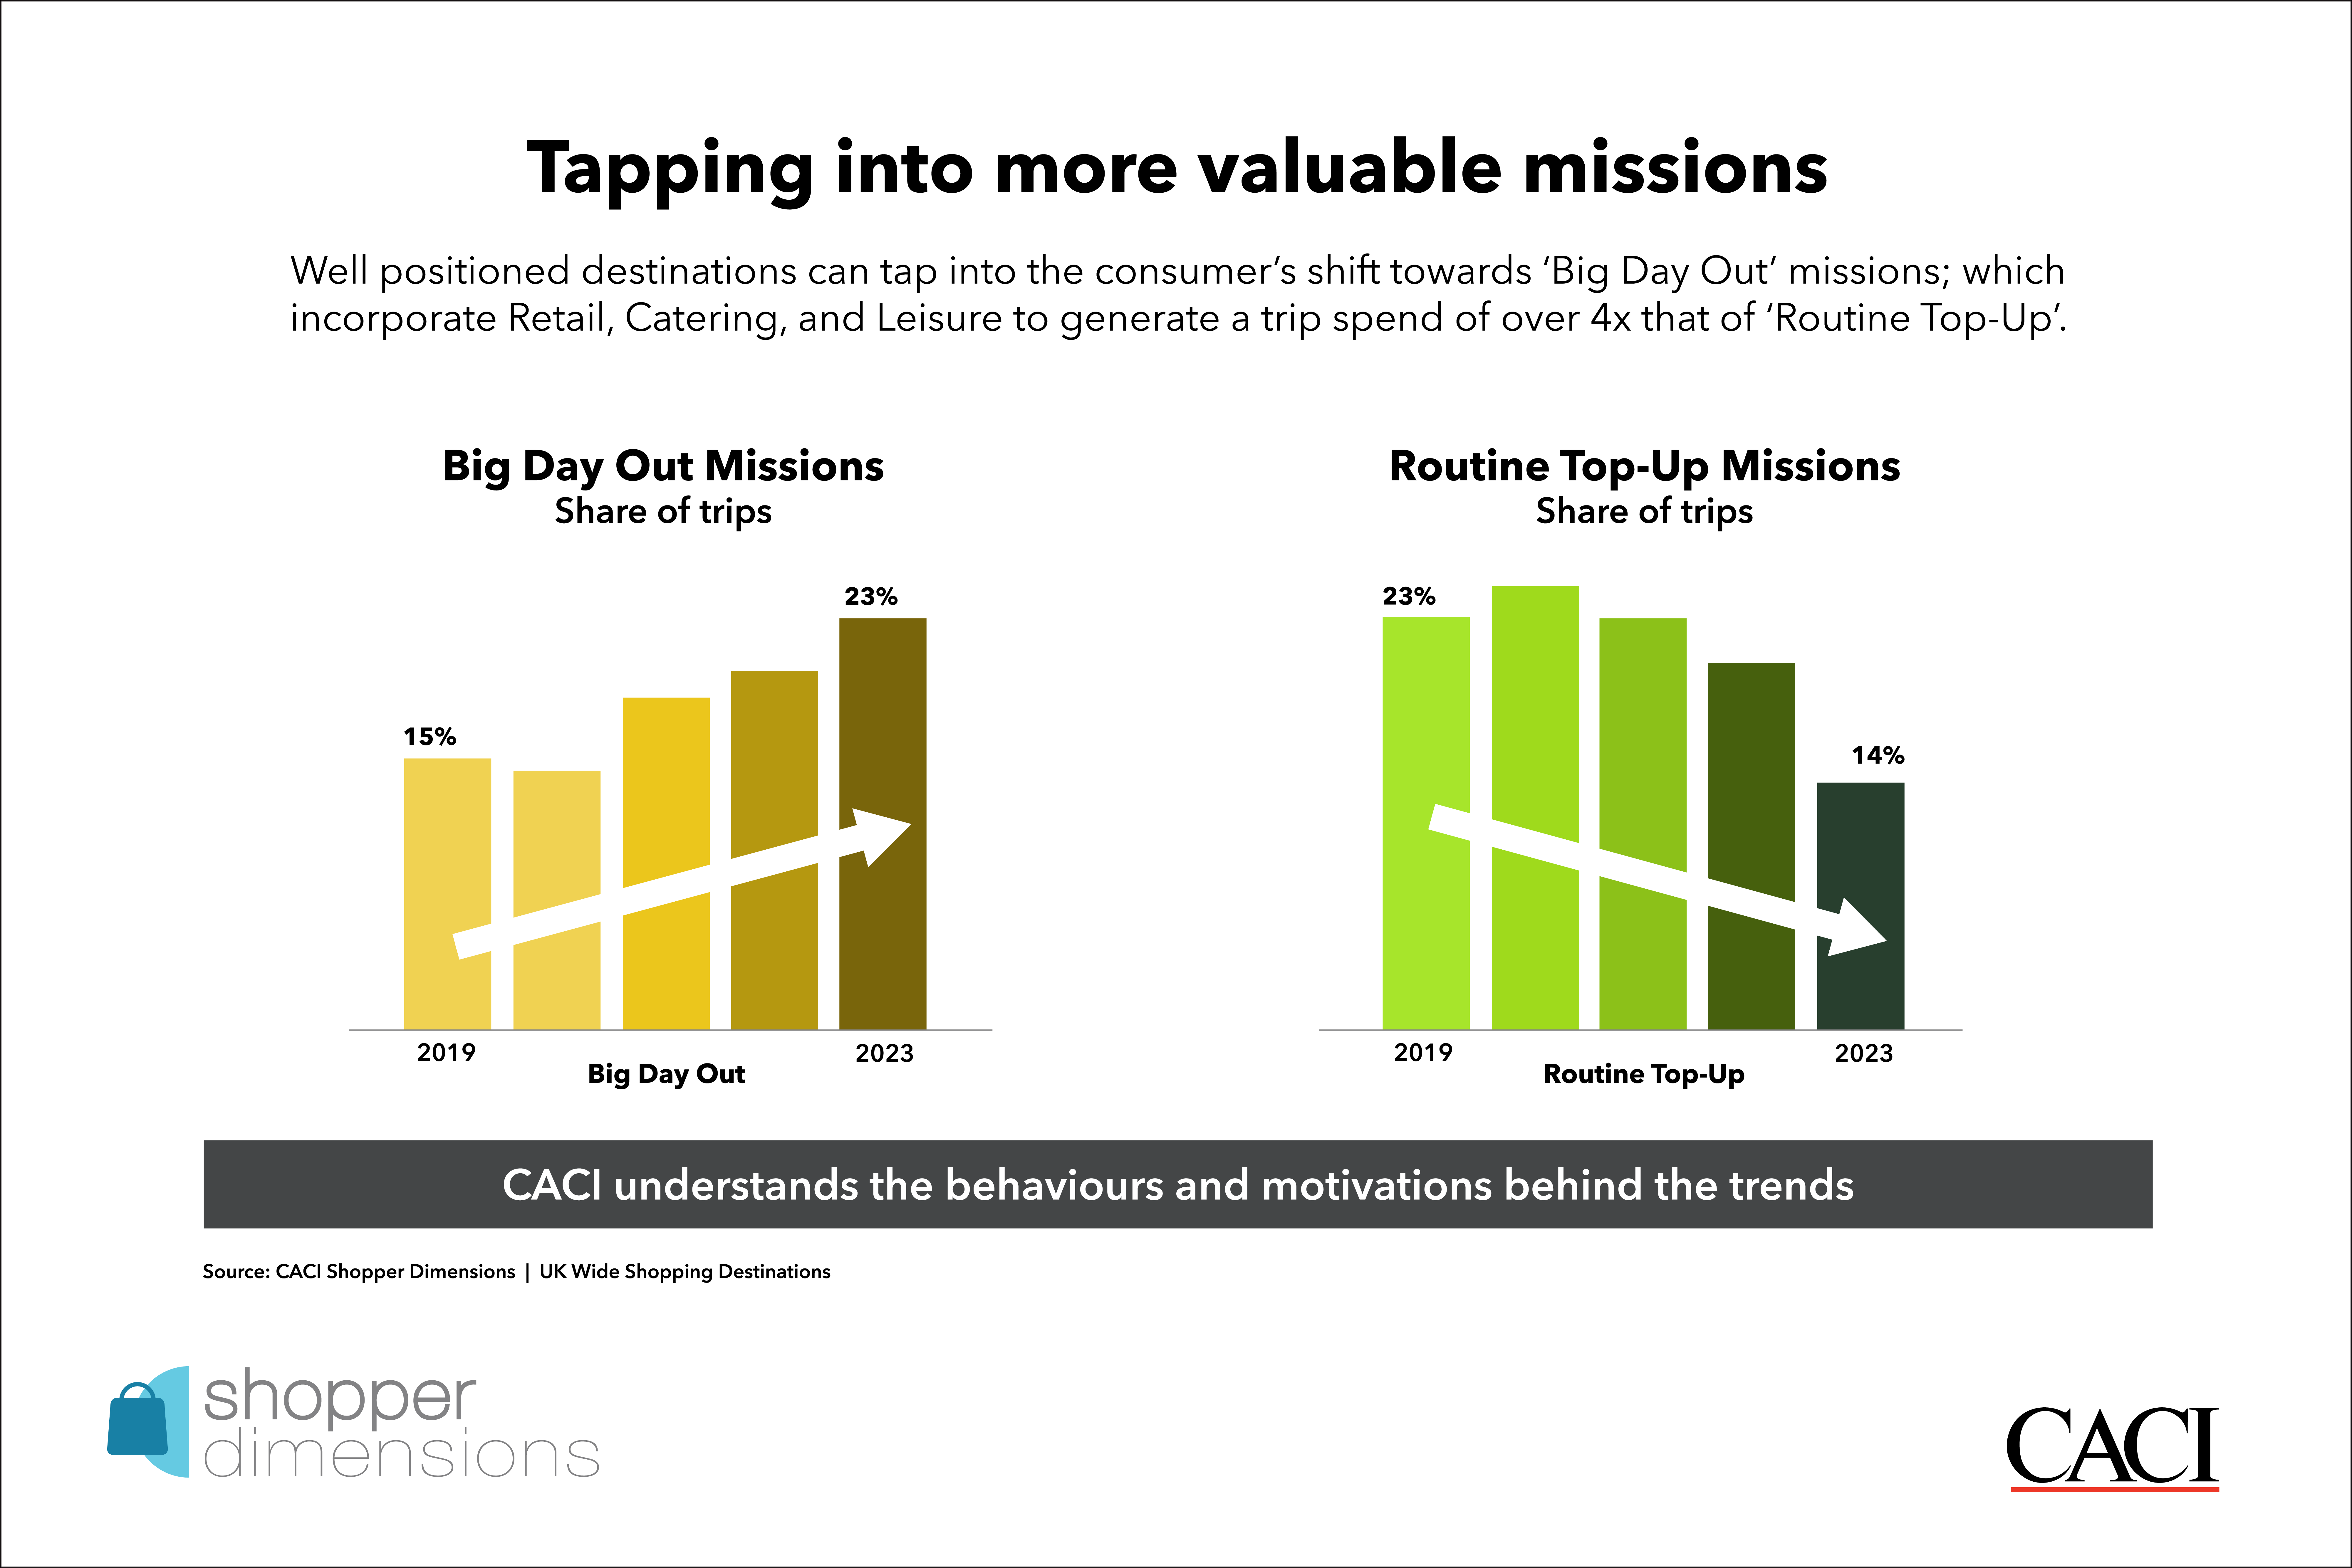
According to our findings, consumers are relinquishing their less engaged “missions” but concentrating trips around the “Big Day Out” trip. This is illustrated in the shifting profile of the top three missions in Shopping Destinations, which explains why a decline in footfall does not necessarily equate to declining spend. At a glance:

  • “Big day out” missions are our more engaged trips. They may be less frequent, but they are ones where multiple retail stores are often combined with Catering and Leisure, resulting in a trip spend 2.4x the average mission. Since 2019, these missions have grown to 23% of all shopping missions. 
  • 37% of “spending time” missions have no purchasing associated with them. While they may contribute to footfall figures, they do not directly contribute to sales-through-tills. Having dropped off post-Covid-19, these trips are now holding flat at a lower shelf. 
  • “Routine top-up” trips are quick, functional and emotionally disengaged trips that a spend of just 47% of an average trip. These trips are dropping out of our repertoire and can be substituted online.

We can therefore see that looking in greater detail at the changing nature of the trips made provides a clearer understanding of commercial asset performance than simply tracking the overall volume of trips.

Key levers to conclude turnover & application methods to target growth outcomes

To make a meaningful impact in asset performance, commercial landlords must move beyond measuring just the number of visits and start reporting the different levers of shopping location spend.  
 
While there are nuances behind the headlines that apply individually to each location, all spend at a shopping location can ultimately be boiled down to three key levers:

  1. The volume (number) of unique shoppers they have 
  2. The frequency of consumers’ visits to a shopping destination 
  3. The value that each shopper spends per trip.

Commercial landlords should consider applying the following methods to each lever to effectively target growth outcomes:

  1. Volume: Convert footfall (visits) into ‘spenders’ and target engagement strategies at driving scheme trial; measured by the percentage of the catchment population currently shopping with you (penetration). 
  2. Frequency: Embrace the different role that your asset plays for different cohorts, diversifying the occupier offering to give shoppers more reasons to return on different missions. 
  3. Value: Determine the highest spending shopper groups to target, segment customers and tailor offers to them to increase cross-shopping opportunities and drive value.

What does good look like?

Now is the time for commercial landlords to leave pre-pandemic comparisons behind. Footfall may be down overall, but the evolution of consumers’ shopping destination behaviour serves as a reminder that relying on the past as an indication of how assets should behave will not lead to longer-term success. If anything, these behaviours have demonstrated that the types of trips people continue to use shopping locations for are more engaged and valuable than ever before.  

Our unique view into how and where consumers are spending has been made possible with the help of datasets like Shopper Dimensions, which enable KPI benchmarking of assets against similar locations across the UK and leverage transactional and data spend insights to enhance decision-making. We can help you calculate the impact of each shopper metric and the headroom compared to peers and catchment.  

To find out more about what Shopper Dimensions can do for you and your business, speak to one of our experts today.

How Earls Court Development Company use data to help inform a new neighbourhood

How Earls Court Development Company use data to help inform a new neighbourhood

Background

The Earls Court Development Company (ECDC) has a vision to bring the wonder back to Earls Court. Their latest proposals demonstrate how Earls Court will be put back on the map, re-emerging as a destination to discover wonder, an ecosystem for creative talent and a showcase for one of the fastest growing industries in the world – clean and climate tech. The masterplan includes 4,000 new homes, 12,000 jobs, culture, community, retail, dining and leisure. 60% of the land is unbuilt, maximising open spaces and opportunities for nature to thrive. The site will have a series of cultural venues, alongside a commercial campus creating a global destination for clean and climate tech research and skills. Sustainability will be the green thread, with one of the largest zero-carbon energy loops in the UK powering the site. A hybrid planning application will be submitted this summer and the first phase will commence in 2026.

The Challenge

  • Understanding how current plans would impact the local market, what retail opportunities should be created and how to create a robust masterplan that would address these factors, despite London’s complex market and a high amount of local competition.
  • Gauging customers and audience — who is already here, what they do, what they need and where they go — in relation to other large-scale central London developments and regeneration master plans in King’s Cross and Battersea.
  • Prior to partnering with CACI, the company solely relied on qualitative data to understand peoples’ perceptions and inform their decision making, such as speaking to people within the community and stakeholders.

The Solution

ECDC was keen to ensure that an optimised neighbourhood would be created for residents both within and outside of the development along with workers and users of the space. To achieve this, CACI interpreted and analysed raw data and numbers for the company, bringing them to life and narrating the results through comparable’s and benchmarks.

It’s very clear in the presentations that we’re given — whether it’s for local authorities or internally — that the evidence base is robust and ultimately indisputable. That was helpful in providing that context and equips us with a robust way to create and define the master plan moving forwards.

Tom Branton, Development Director at ECDC

The CACI data sources included as part of this study were:

  • Mobile App Data: Mobile location data generated a precise view into the location’s catchment and visitor profiles, ensuring ECDC would innately understand how visitor profiles and their respective behaviours varied over time. This helped the company assess who users are along with their demographic and spending power, along with insights into how visits changed over a day and week.
  • Acorn: CACI’s consumer segmentation model, Acorn, enabled ECDC’s understanding of who new residents would be and their needs, and who would shop at the development.
  • Location Dynamics: Location Dynamics is CACI’s spatial interaction model, creating a digital mirror of the UK retail landscape replicating consumer flows. The engine of the model is a machine learning algorithm that provides future forecast catchments. For ECDC, CACI used Location Dynamics to understand the expected current catchment and spend, as well as leakage to nearby destinations, to provide a detailed understanding of the local retail landscape.

The Results

  • Newfound understanding of the ‘size of the prize’ of wider London and tourist demographics and audiences. ECDC historically relied on gut instinct when it came to decision making, but working with CACI ensured they were backed with concrete evidence. For example, CACI’s data showed that one-third of the total potential spend in the development area could come from out of catchment.
  • Enhanced decision-making through evidence-based data on the community. With the development situated across both the London Borough of Hammersmith and Fulham and the Royal Borough of Kensington and Chelsea, their perceptions of the surrounding community to inform decision-making — while strong — are now rooted in evidential data. This has served to alter their perceptions to ensure that a comprehensive understanding of residents and borough dwellers can be met and their audience narrative can be shaped accordingly.

The Future

In the coming years, CACI will continue to support ECDC in the data-backed planning and construction of residential units, retail landscape and office space development.

Read the case study:

You can access and download the full case study here. If you have any questions or want to learn more about CACI’s solutions, please get in touch with us.

Why Taunton is a perfectly balanced place to live

Why Taunton is a perfectly balanced place to live

This final blog in our series on balanced locations brings us to Taunton, an idyllic town near the southwest England countryside with a captivating history, landscapes and arts and culture scene that have earned the town its spot on our list of perfectly balanced places to live per our report, “Six Pillars of Success: Building Resilient Places”. 

If you have yet to read our blog that introduces these pillars, we consider a ‘perfectly balanced’ place to be:   

  • One that houses a suitable mix of chain and independent retailers at optimal sizes  
  • Supplies unique offline experiences that meet the community’s needs  
  • Provides community infrastructure that supports daily living  
  • Offers adequate residential properties for the community  
  • Offers employment opportunities and flexible working spaces  
  • Encourages time spent outdoors in green spaces

So, what exactly are the driving factors behind Taunton being a perfectly balanced place to live?

Pillar 1: Representation & proper sizing of independent & chain retailers  

Taunton’s town centre benefits from a mix of well-known brands like Primark, TK Maxx, Sports Direct and Marks & Spencer, while also being home to thriving independent and specialist retailers. In fact, independent retailers in Taunton comprise ~50% more of the retail mix than benchmark locations.

Bath Place stands out as a particular hub for independent retailers. Dating back to the 18th century, this historic street is lined with an array of independent businesses and services that can be reached on foot by pedestrians. Many of the shop fronts feature their original detailing to truly transport passers by into the Georgian era.  

Pillar 2: Uniquely tailored offline experiences

To get in on the sports, music and leisure scene in Taunton, Somerset County Cricket Club has something for every type of enthusiast. Founded in 1875, this renowned sports club situated close to the town centre represents the county of Somerset. To this day, it serves as a spot for watching cricket, attending concerts, catching a film at its open-air cinema and much more.

For those looking for a community social hub that doubles as a performing arts centre, look no further than Taunton Brewhouse. As the region’s principal arts centre, its programme of high-quality dance, musical and theatre shows along with workshops and pop-up shops create a diverse and all-encompassing environment that appeals to one and all.

There is also no shortage of cafes, restaurants and bars to satisfy locals day or night. 

Pillar 3: Engaging community infrastructure 

Taunton’s centre is brimming with museums, galleries, a library and numerous services to meet locals’ varying needs and interests.  

A visit to Taunton Castle, a Grade I Listed Scheduled Ancient Monument, can be paired with the Museum of Somerset, also situated within the 12th century castle walls, housing prehistoric artifacts to modern galleries. The Somerset Military Museum is also housed within the Museum of Somerset. A historic almshouse saved by the Taunton Heritage Trust can also be found on the Museum grounds.  

At the heart of the town lies Taunton Library, a public library that offers internet access and printing services. Civic services such as the Somerset Registration Service, Jobseekers Recruitment Services, Taunton JobCentre and the Somerset Council offices can also be found here.  

A modern and affordable Nuffield Health gym boasts plenty of equipment and classes, encouraging locals’ maintenance of fitness and wellbeing. 

Pillar 4: Support social cohesion through optimised residential design 

Situated close to the picturesque countryside while also having well-connected transport links, inhabitants of all ages and demographics can appreciate what this town has to offer. Taunton’s housing market appeals to a variety of renters and homebuyers, with a broad range of housing available from charming cottages to contemporary flats. Average house prices in Taunton are lower than seen across the southwest. At just £786, monthly rental payments sit at 22% of local income levels (below national averages of 25%).  

Pillar 5: Sufficient & accessible work opportunities for the local population

Taunton is a major regional employment hub. The town is accessible via the M5 and has good train links including a direct service to London in under two hours, making it an appealing place to live for commuters. Only 1.61% of Taunton’s population is considered to be “Economically Active: Unemployed”.
Pillar 6: Appealing open spaces for the community to dwell in 

When in need of a break from city life, locals and visitors can escape into one of Taunton’s many parks and nature oases.  

Vivary Park is a popular choice that is just a few minutes away from the town centre. With its namesake inherited from its medieval usage as a fish farm or vivarium for the priory and castle, the park features a mini golf course, tennis courts, playground and model railway. In just a short drive from Taunton, Blackdown Hills National Landscape, considered an Area of Outstanding Natural Beauty, can be found, offering visitors breathtaking landscapes and opportunities to hike, cycle and spot wildlife.

To learn how our six property pillars can help ensure you are creating resilient places, please speak to one of our Placemaking and Property experts.