Reporting-ms Performance Issues – Solution Overview
Share this article
The Problem
Picture the scene; a new application has been carefully developed and nurtured into existence. It has been thoroughly tested in a small test environment, and the team are awaiting its first deployment to a multi-pod environment with bated breath. The big day comes and…. the CTF tests immediately highlight severe issues with the application, cue tears.
Naturally, this was not the fanfare of success the team had been hoping for. That being said, there was nothing for it but to dive into everyone’s favourite debugging tool… Kibana.
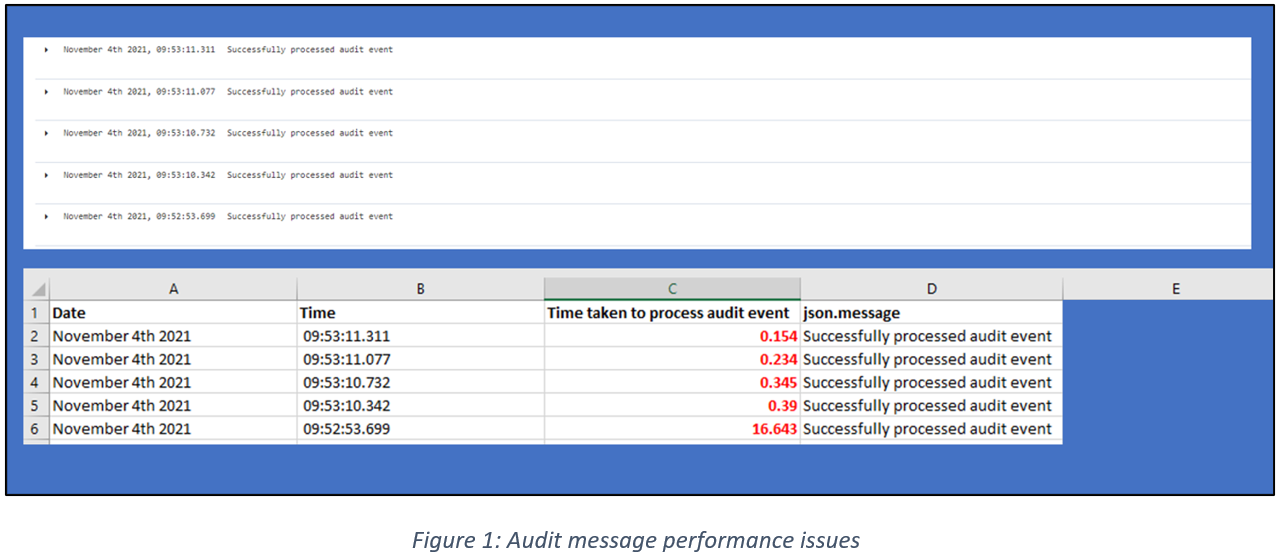
Checking the logs in Kibana confirmed the team’s worst fears. Audit messages were being processed by the app far too slowly.
• Figure 1 below shows audit events taking up to 16.5s to be processed. This process time should (under normal circumstances) be under 0.1s per message.
• Pods were seen to be idle (while under load) for up to a minute at a time.
Background
Performance problems are never fun. The scope tends to be extremely wide and there is no nice clean stack trace to give you a helping hand. They often require multiple iterations to fully solve and more time investigating and debugging than implementing a fix.
In order to know where to begin when looking at the performance of an application, it’s important to understand the full flow of information throughout the app so that any critical areas/bottlenecks could be identified.
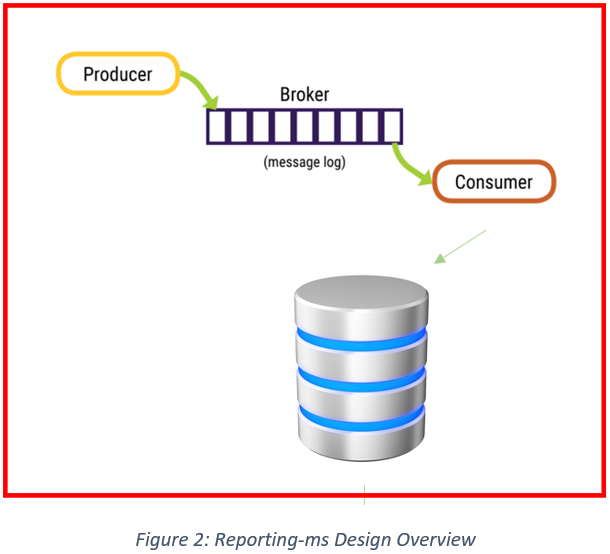
• In this scenario the diagram shown in Figure 2 represents the key processes taking place in the app. The producer of the messages (audit events) fires them onto a Broker (a Kafka queue), from which they are consumed by the application (reporting-ms) and stored in a database.
Each of these areas could be to blame for the slow processing times and so it was important that each was investigated in turn to ensure the appropriate solution could be designed.
The steps decided for the investigation were therefore:
- Investigate audit-enquiry performance
- This app is the producer of the messages for the CTF tests – if this application takes too long to put the messages onto the broker, it would increase the time taken for a full set to be processed and committed.
- Investigate pod performance
- These pods allocate resource to reporting-ms – if the app is not allocated enough memory/CPU then it would cause performance issues,and explain the issue of idle pods under load.
- Investigate database load
- As this is Aurora based, we have a separate instance for reading/writing. It is important to understand whether these are resource bound to ensure adequate performance takes place.
- Investigate application (reporting-ms) performance
- The application parses the incoming messages and prepares them for storage in the database. If there are inefficiencies in the code this could also decrease performance.
The investigation
- Audit-enquiry
- 100s of audit messages could be added per second meaning this was ruled out as the cause of the issues.
- Pod Resource Allocation
- Looking at metrics in Grafana it was possible to see that the pods never hit more than 60% of their allocated CPU/memory thresholds, meaning they were not resource bound.
- Database load
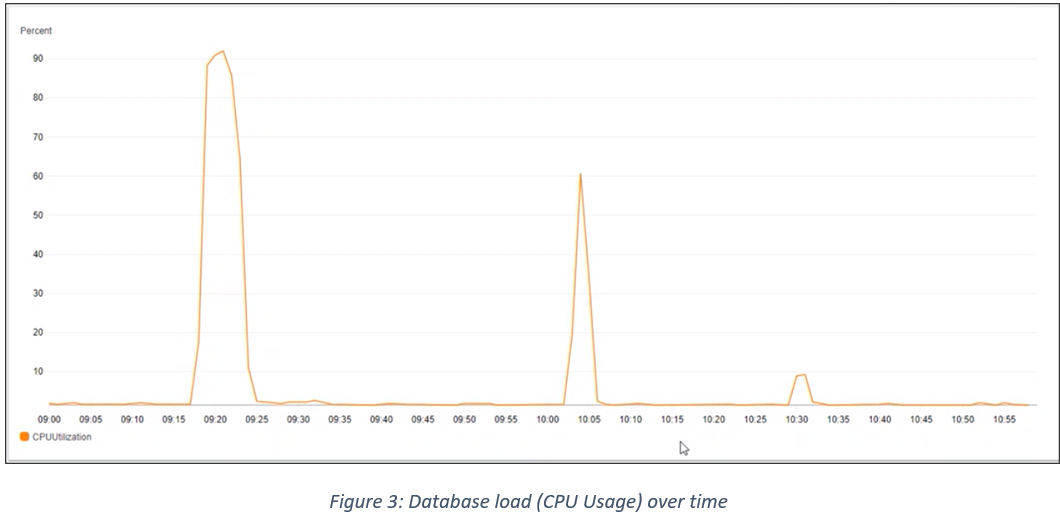
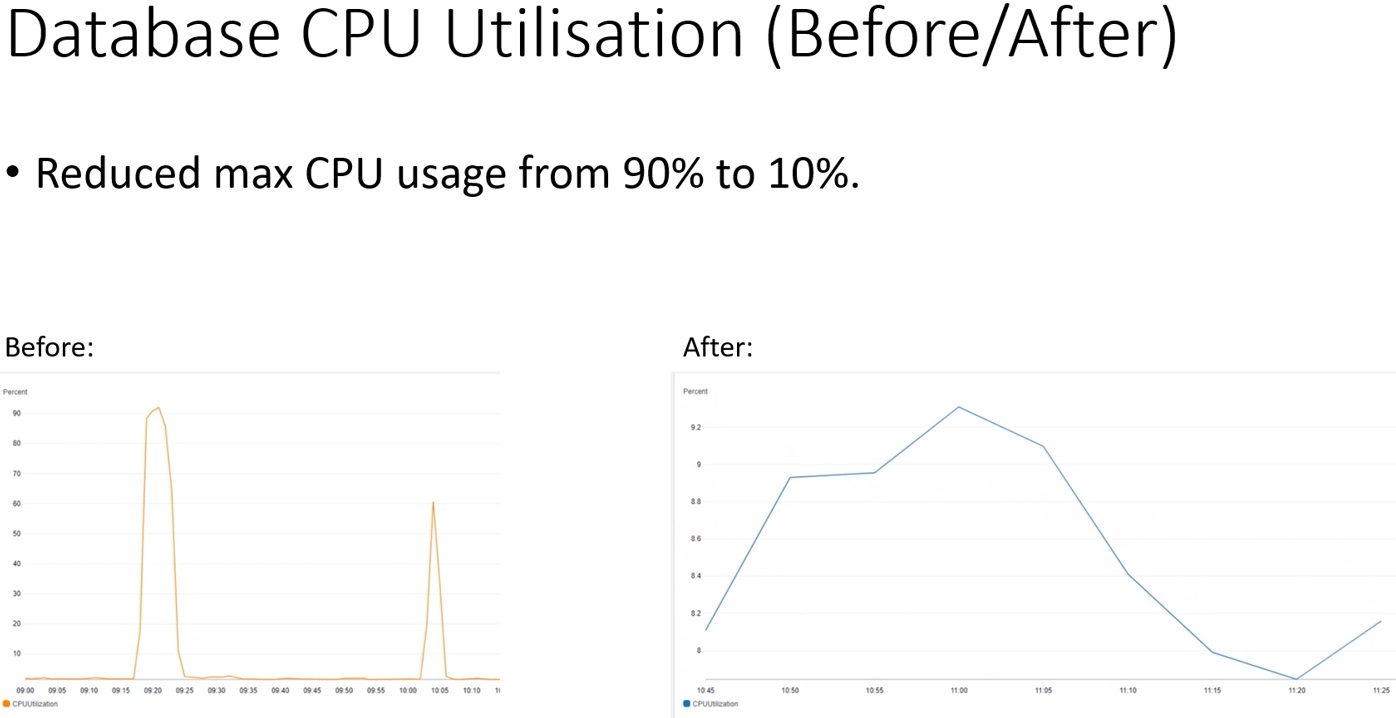
- As seen in Figure 3, it is possible to see that the database was hitting 90% or more CPU usage during the CTF tests, indicating the issue lay in the area between reporting-ms and the database.
As mentioned above, no stack trace was available for the team to rely on. No exceptions were being fired and other than slow processing times all seemed to be well with the application. The only way forward was to create our own set of logging to try and peel back the layers of pain and decipher what area required a quick amputation.
The first iteration of this logging did not go well. The key processes had been identified, each one surrounded by a simple timer, and a flashy new set of logs were being seen in the console output. Unfortunately, 99% of the time was appearing under one of these processes, and database reads/writes were seemingly instantaneous. This, as one of the team more eloquently described at the time, did not seem right (rephrased for your viewing), especially considering the extreme CPU usage seen above. Once again, the tool shed had to be reopened, spades retrieved, and more digging into the problem begun.
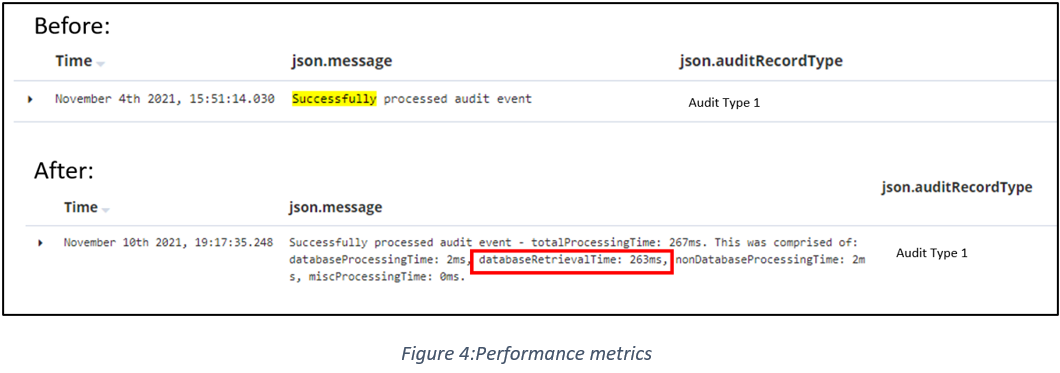
The cause of our logging woes turned out to be an @Transactional annotation that surrounded our audit-message processing. This processing prevented the actual commits to the database from taking place on the areas indicated in the code itself. With this in mind, the second iteration of logging was released, and a much more insightful set of metrics could be seen in the console log. The output of these metrics can be seen below in Figure 4.
- Reporting-ms
- The statistics mentioned above were added to track performance time of key processes inside the app. As seen in Figure 4, the database retrieval time was almost 90% of the total processing time, further validating our theory that this was the cause of the issue.
- By turning on Hibernate’s ‘show-sql’ feature it was possible to see that 20+ select queries were run per processed message. The cause of this was eager loading on the entities (all information linked to the incoming message was being retrieved from the database).
The solution/results
With the investigation complete and the root cause revealed, the team eagerly set upon implementing a solution.
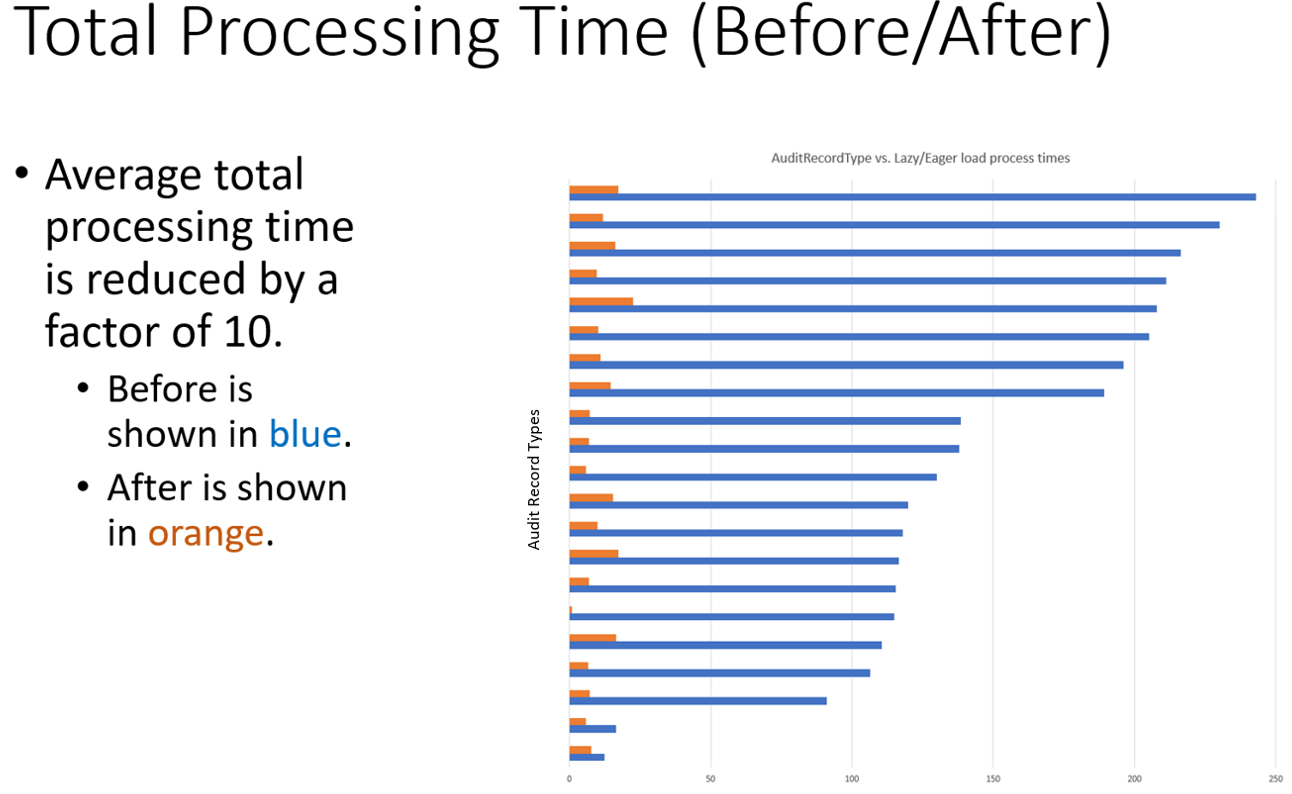
The resolution in this scenario was to add a lazy-load implementation to the entities within reporting-ms and cache any of the key lookup tables that weren’t too large/unlikely to change. By adding this strategy, the number of select queries run against the database per message were reduced from 20+ to 5 or less.
A day or two later and application_v2 was ready for deployment. Thankfully (for the sake of our mental well-being), the CTF results returned a much more positive outlook this time! More in-depth results of this implementation can be seen in some of the below screenshots of database CPU usage and average audit message processing times. In particular, the 90% reduction in processing time was brilliant to see and the team were delighted with the corresponding time saves and improvements in the test runs.
Find out more about our secure application development capabilities.
Share this article