Five key challenges convenience clusters and mobile app data can help you solve
Share this article
It can be hard to segment and understand your existing estate let alone find new locations to expand. Through using CACI’s Convenience Cluster data the first part of the puzzle is already solved. There are over 32,000 pre-defined convenience clusters within the UK to define local retail areas. Centres can range from local parades right through to city centre locations and describe both the extent and function of all retail locations. This year’s release has seen the introduction of two new exciting changes. The first is the introduction of city zones helping you to understand the micro level nuances of city centres into distinct zones split by function to the shopper. The second is the incorporation of mobile app data for each of the UK’s 32,000 centres to describe the centres in detail understanding who is there, by time of day, day of week and purpose.
Using the new mobile app data our clients are now able to respond to some of the biggest questions that have been facing their businesses including:
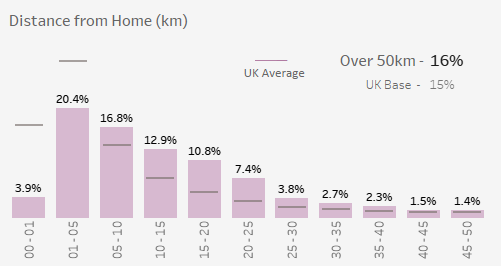
1. IS THE CATCHMENT OF MY STORE RESIDENTIAL OR TRANSIENT?
Transient stores need a very different range and layout and the drivers of success are completely different to residential stores. Quickly identifying the mix between people who are close to or further from home can help you to create high performing, successful and tailored stores. Mobile app data combined with Convenience Clusters goes beyond the traditional drivetime or radii catchments to capture who is within that centre no matter where they have come from. Through capturing home locations for devices and therefore knowing how far people have travelled to visit a centre audience classes have been created to split centres into residential, worker, local visitor or visitor. Using the example below you can begin to capture detailed information on how far shoppers have travelled to visit that centre enabling you to make informed decision on store formats, ranging and the potential of a location for your offer.
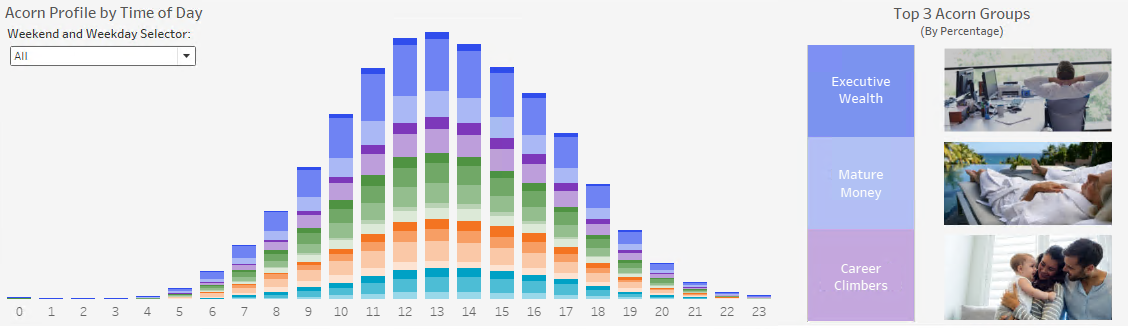
2. WHO COULD MY CUSTOMERS BE?
By understanding not just who is coming into your store, but who is passing in the immediate area and when, you can understand the nature of the opportunity on your doorstep and make sure you are set up to maximise on it. Mobile app data is coded with Acorn, CACI’s customer segmentation giving visibility and additional supporting information on who is visiting each centre. Through coding up customers based on their home postcode the dashboard reports back on what shopper types are visiting the centre and at what time of day. This is really valuable to our clients who are working out how to tailor to a location and whether the passing footfall contains the right mix of demographics for their potential store. This can help you identify opportunities and look beyond where people to live to capture your target audience wherever they may be during the course of the day or week.
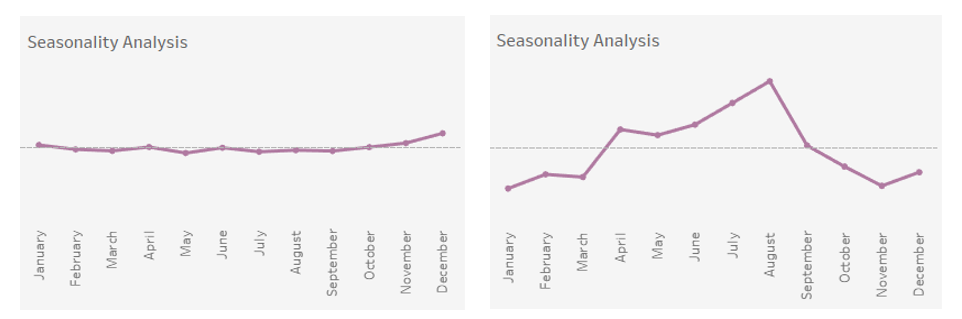
3. SHOULD I BE PLANNING FOR BIG CHRISTMAS OR SUMMER PEAK HERE?
Seasonality is hugely important when it comes to operational planning of activities such as new store turnover forecasting or marketing campaigns. Each cluster is classified by seasonality identifying for example locations with summer peaks, Christmas peaks and term time peaks. Examples below show Westfield London’s Christmas peak and Fowey in Cornwall’s strong summer holiday peak. Clients ranging from CPG brands to grocers have been utilising this data to predict and plan for seasonality across their estate. Having an easy to use classing filter allows you to segment your estate on expected seasonal uptakes making it easy to plan for these fluctuations.
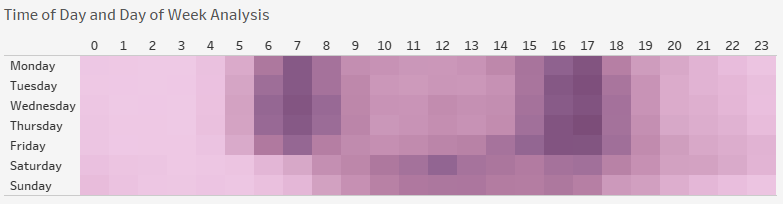
4. WHAT WOULD THE OPTIMAL OPENING HOURS BE?
Mobile app data linked with Convenience Clusters provides an indicator of busyness within the centre on a scale of 1 (not busy) to 20 (very busy). This data combined with visibility on when shoppers are visiting by time of day and day of week will inform key business decisions ranging from store opening hours, key restocking times, extra staff requirements and even vulnerable or quiet shopping hours. Taking the example of the time of day chart below it is clear that on weekdays there are strong rush hour peaks with customers interacting with the centre between 6am to 8am and 4pm to 6pm. On the weekend a very different time of day profile can be seen with shoppers not appearing in numbers until 10am.
5. WHAT IS THE MISSION OF MY STORE?
Combining the powerful data demonstrated on who is in the centre by demographic group with when they are visiting the centre by time of day builds up a clear picture of the mission of shoppers within the centre. For example, rush hour peaks in the time of day data combined with a high proportion of young family groups e.g. ‘Young Families on the Go’ that your store is serving a time poor shopper group who would be looking for a meal solution for tonight or top up items for their last minute school bake sale for example. Segmenting your estate by these variables will tell you if there is untapped opportunity for a new range or concept for your store.
Convenience Clusters provide you with information about the physical extent of locations and what is there on the ground while Mobile App data paints a vivid picture on the people visiting those locations, in combination this creates a powerful tool to answer the big questions of 2020. With a number of areas in the UK going in to tier 2 and tier 3 lockdowns, the weekly movement tracking of 32,000 convenience clusters becomes essential to businesses to understand the level of activity across their estates.
For more information on how your company can benefit from Convenience Clusters and mobile app data please contact: cking@caci.co.uk or vkirillovs@caci.co.uk
Share this article